Download
1 / 30
300 likes | 426 Views
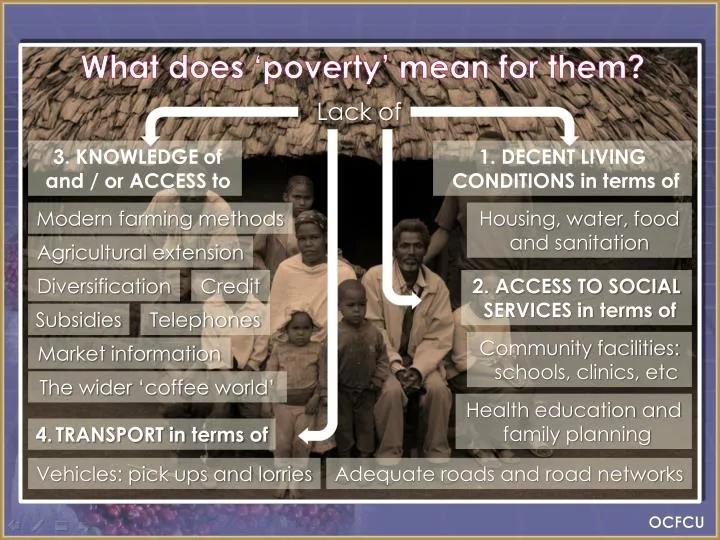
What does ‘poverty’ mean for them?. Lack of. 3. KNOWLEDGE of and / or ACCESS to. 1. DECENT LIVING CONDITIONS in terms of. M odern farming methods. Housing, water, food and sanitation. Agricultural extension. Diversification. Credit. 2. ACCESS TO SOCIAL SERVICES in terms of. Subsidies.

E N D
What does ‘poverty’ mean for them? Lack of 3. KNOWLEDGE of and / or ACCESS to 1. DECENT LIVING CONDITIONS in terms of Modern farming methods Housing, water, food and sanitation Agricultural extension Diversification Credit 2. ACCESS TO SOCIAL SERVICES in terms of Subsidies Telephones Community facilities: schools, clinics, etc Market information The wider ‘coffee world’ Health education and family planning 4.TRANSPORT in terms of Vehicles: pick ups and lorries Adequate roads and road networks OCFCU
‘Measuring’ Ethiopia Workforce in farming: 88% People having water as goodas this: 22% Making Ethiopia one of the world’s least developed countries Nearly 90% live on less than $2.00/day Adults who can read and write: 41.5% How long people can expect to live: 47.6 years Average yearly income per person: $97.00 30 doctors for every 1,000,000 people Mothers who die while giving birth: 850 out of 100,000 births Children dying before their first birthday: 112 out of every 1000 People who don’t get enough food to eat: 46% OCFCU
No of primary cooperatives: 19,147 Members: 4,323,048 Capital : 1,475,256,047
Employment Condition Number of Employee Primary coops. 57,441 Unions 620
Date of Establishment: 01 June, 1999 • Date of Registration: 28 June, 1999 • Initial Members: 22503 coffee growers organized in 34 Coops • Initial capital: 825,000 birr
Organizational Structure of Oromia Coffee Farmers Cooperative Union/OCFCU/ General Assembly Supervisory Committee Board Of Directors General Manager Deputy General Manager Finance Division Planning and Programming Division Coffee Export Division Audit Division Administrative Division
The Coffee Trade Chain Free Market Cooperative Farmer Farmer Collector Cooperative Profit Supplier Union Profit Exporter Buyer Buyer Fair Trade Premium Roaster Roaster Retailer Retailer consumer consumer
Membership Of the Union in Year
Volume And Value Of Out Put Sold By The Union In Years 8.80 birr = 1 USD
Volume And Value Of Out Put Sold By The Union In Years
Net income of the Union in years 13,933,097.29 7,020,447.00 6,865,844.00 5,819,096.00 5,468,002.66 2,181,624.92 289,184.86
Status of Dividend Payment to member cooperatives in year
Members Received Dividend 110 85 78 30 20 22 8
Dividend paid in 6 years 6,966,548 3,580,761 3,208,053 2,485,947 2,270,598 1,527,137 262,855
Premium from Fair Trade Sales
Clean water supply to coffee farmers by OCFCU from support of fair trade roaster
Financial Position Of the Union In 6 Years
Growth of fixed asset in 6 years 3,711,333 2,633,218 2,442,578 1,747,430 876,643 100,224 60,865
Growth in Capital in 6 years 22,929,366 14,514,832 11,812,582 9,306,448 3,490,358 1,631,646 857,360
Support And Projects Make Trade Fair Campaign/OXFAM/ Progresso Café Black Gold Cashew Gongogo Bee Keeping Forest Coffee Coffee Tourism Other Projects on pipe line OCFCU
Percentage of Sales by coffee types to the USA % Volume in KG 598,500 346,500 203,400 195,300 57,000 60,060 37,200 40 23.13 13.57 13 3.8 4 2.5 • Yirgacheffe-2 • Harar 4/5 • Sidamo 4/5 • Sidamo-2 • Limu-2 • Jimma 4/5 • Nekemte 4/5 Total: 1,497,960 OCFCU
Genuine Cooperatives • For sustainable development • To make Poverty History