Download
1 / 1
10 likes | 67 Views
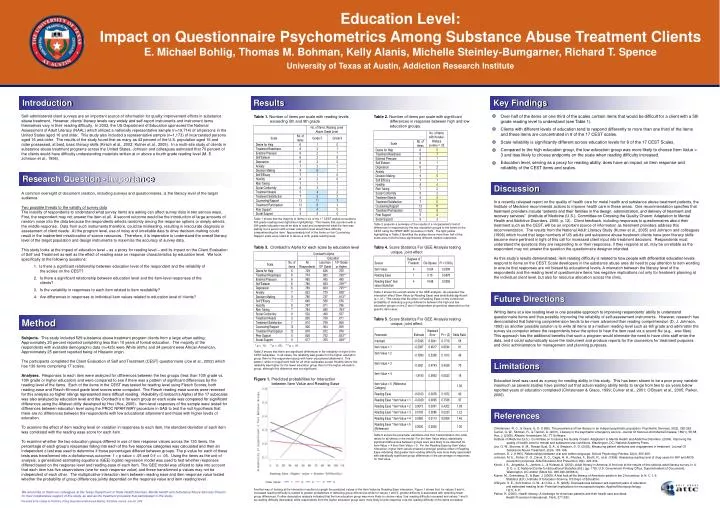
Education Level: Impact on Questionnaire Psychometrics Among Substance Abuse Treatment Clients E. Michael Bohlig, Thomas M. Bohman, Kelly Alanis, Michelle Steinley-Bumgarner, Richard T. Spence University of Texas at Austin, Addiction Research Institute. Introduction. Results. Key Findings.

E N D
Education Level: Impact on Questionnaire Psychometrics Among Substance Abuse Treatment Clients E. Michael Bohlig, Thomas M. Bohman, Kelly Alanis, Michelle Steinley-Bumgarner, Richard T. Spence University of Texas at Austin, Addiction Research Institute Introduction Results Key Findings Self-administered client surveys are an important source of information for quality improvement efforts in substance abuse treatment. However, clients’ literacy levels vary widely and self-report instruments and instrument items themselves vary in their reading difficulty. In 2003, the US Department of Education sponsored the National Assessment of Adult Literacy (NAAL) which utilized a nationally representative sample (n=19,714) of all persons in the United States aged 16 and older. This study also included a representative sample (n=1,173) of incarcerated persons aged 16 and older. The results of the study found that as many as 43 percent of the U.S. population aged 16 and older possessed, at best, basic literacy skills (Kirsch et al., 2002; Kutner et al., 2005). In a multi-site study of clients in substance abuse treatment programs across the United States, Johnson and colleagues estimated that 70 percent of the clients would have difficulty understanding materials written at or above a fourth grade reading level (M. E. Johnson et al., 1996). • Over half of the items on one third of the scales contain items that would be difficult for a client with a 5th grade reading level to understand (see Table 1). • Clients with different levels of education tend to respond differently to more than one third of the items and these items are concentrated in 9 of the 17 CEST scales. • Scale reliability is significantly different across education levels for 8 of the 17 CEST Scales. • Compared to the high education group, the low education group was more likely to choose Item Value = 3 and less likely to choose endpoints on the scale when reading difficulty increased. • Education level, serving as a proxy for reading ability, does have an impact on item response and reliability of the CEST items and scales. Table 1. Number of items per scale with reading levels exceeding 5th and 9th grade Table 2. Number of items per scale with significant differences in response between high and low education groups. Research Question - Importance Discussion A common oversight of document creation, including surveys and questionnaires, is the literacy level of the target audience. Two possible threats to the validity of survey data The inability of respondents to understand what survey items are asking can affect survey data in two serious ways. First, the respondent may not answer the item at all. A second outcome would be the introduction of large amounts of random noise into the data because the respondents selects randomly among the response options or simply selects the middle response. Data from such instruments therefore, could be misleading, resulting in inaccurate diagnosis or assessment of client needs. At the program level, use of noisy and unreliable data to drive decision-making could result in the inadvertent misallocation of scarce resources. Therefore, it is imperative to understand the overall literacy level of the target population and design instruments to maximize the accuracy of survey data. This study looks at the impact of education level – as a proxy for reading level – and its impact on the Client Evaluation of Self and Treatment as well as the effect of reading ease on response characteristics by education level. We look specifically at the following questions: 1. Is there a significant relationship between education level of the respondent and the reliability of the scales on the CEST? 2. Is there a significant relationship between education level and the item-level responses of the clients? 3. Is the variability in responses to each item related to item readability? 4. Are differences in responses to individual item values related to education level of clients? In a recently released report on the quality of health care for metal health and substance abuse treatment patients, the Institute of Medicine recommends actions to improve health care in these areas. One recommendation specifies that treatment providers include “patients and their families in the design, administration, and delivery of treatment and recovery services” (Institute of Medicine (U.S.). Committee on Crossing the Quality Chasm: Adaptation to Mental Health and Addictive Disorders, 2006, p. 12). Client feedback, including responses to questionnaires about their treatment such as the CEST, will be an important source of information as treatment providers address this recommendation. The results from the National Adult Literacy Study (Kutner et al., 2005) and Johnson and colleagues (1996) which found that large numbers of US adults and substance abuse treatment clients have poor literacy skills become more pertinent in light of this call for increased client input into treatment decisions. Respondents must understand the questions they are responding to or their responses, if they respond at all, may be unreliable as the respondent may not answer the question the questionnaire designer intended. As this study’s results demonstrated, item reading difficulty is related to how people with differential education levels respond to items on the CEST. Scale developers in the substance abuse area do need to pay attention to item wording to ensure that responses are not biased by educational levels. A mismatch between the literacy level of the respondents and the reading level of questionnaire items has negative implications not only for treatment planning at the individual client level, but also for resource allocation across the clinic. Table 1 shows that the majority of items in six of the 17 CEST scales exceeded a fifth grade reading level (light blue highlighting). This means that a person with a fifth grade education would be able to read and comprehend what the item was asking, but a person with a lower education level would have difficulty comprehending the item. Approximately half of the items on the Counseling Rapport scale were rated at or above a ninth grade reading level. Table 2 presents a summary of the results of a nonparametric test of differences in responses by the two education groups to the items on the CEST using the NPAR1WAY procedure in SAS. The light yellow highlighting in Table 2 identifies the scales where more than half of the items were found to have significantly different median responses. Table 3. Cronbach’s Alpha for each scale by education level Table 4. Score Statistics For GEE Analysis testing unique, joint effect Table 4 shows the overall results of the GEE analysis. As expected, the interaction effect (Item Value by Reading Ease) was statistically significant (p < .01). This shows that the effect of Reading Ease on the conditional probability of detecting a group difference between the high and low education groups on the Z test of independent proportions depended on the specific item value. Future Directions Writing items at a low reading level is one possible approach to improving respondents’ ability to understand questionnaire items and thus possibly improving the reliability of self-assessment instruments. However, research has demonstrated that listening comprehension tends to be more advanced than reading comprehension (D. J. Johnson, 1993) so another possible solution is to write all items at a medium reading level such as 6th grade and administer the survey via computer where the respondents have the option to hear the item read via a sound file (e.g., .wav files). This approach has the additional benefits that such a program would eliminate the need to have clinic staff enter the data, and it could automatically score the instrument and produce reports for the counselors for treatment purposes and clinic administrators for management and planning purposes. Table 5. Score Statistics For GEE Analysis testing unique, joint effect Method Subjects. This study included 529 substance abuse treatment program clients from a large urban setting. Approximately 20 percent reported completing less than 10 years of formal education. The majority of the respondents with available demographic data (n=425) were White (69%) and 24 percent were African American. Approximately 25 percent reported being of Hispanic origin. The participants completed the Client Evaluation of Self and Treatment (CEST) questionnaire (Joe et al., 2002) which has 130 items comprising 17 scales. Analyses. Responses to each item were analyzed for differences between the two groups (less than 10th grade vs. 10th grade or higher education) and were compared to see if there was a pattern of significant differences by the reading level of the items. Each of the items in the CEST was tested for reading level using Flesch Scores; both reading ease and Flesch-Kincaid grade level scores were computed. The Flesch reading ease scores were reversed for this analysis so higher ratings represented more difficult reading. Reliability (Cronbach’s Alpha) of the 17 subscales was also analyzed by education level and the Cronbach’s α for each group on each scale was compared for significant differences using the Alfatest utility developed by Hox (Hox, 2005). Item-level responses of the sample were tested for differences between education level using the PROC NPAR1WAY procedure in SAS to test the null hypothesis that there are no differences between the respondents with low educational attainment and those with higher levels of education. To examine the effect of item reading level on variation in responses to each item, the standard deviation of each item was correlated with the reading ease score for each item. To examine whether the two education groups differed in use of item response values across the 130 items, the percentage of each group’s responses falling into each of the five response categories was calculated and then an independent z-test was used to determine if those percentages differed between groups. The p-value for each of these tests was transformed into a dichotomous outcome: 1 = p value < .05 and 0 if >= .05. Using the items as the unit of analysis, a generalized estimating equations (GEE) logistic regression model was used to test whether responses differed based on the response level and reading ease of each item. The GEE model was utilized to take into account that each item has five observations (one for each response value) and these transformed p-values may not be independent of each other. The multiplicative interaction term between reading ease and item response value tested whether the probability of group differences jointly depended on the response value and item reading level. * p < .10; ** p < .05; *** p < .01. Table 3 shows that there are significant differences in the reliability of eight of the CEST subscales. In all cases, the reliability was greater for the higher education group than for the respondent group with lower educational attainment. This pattern, while not significant held for all other subscales except Hostility where the reliability was higher for the lower education group than for the higher education group, although this difference was not significant. Limitations Figure 1. Predicted probabilities for Interaction between Item Value and Reading Ease Education level was used as a proxy for reading ability in this study. This has been shown to be a poor proxy variable inasmuch as several studies have pointed out that actual reading ability tends to range from two to six years below reported years of education completed (Christensen & Grace, 1999; Currier et al., 2001; O'Bryant et al., 2005; Parker, 2000). References Christensen, R. C., & Grace, G. D. (1999). The prevalence of low literacy in an indigent psychiatric population. Psychiatric Services, 50(2), 262-263. Currier, G. W., Sitzman, R., & Trenton, A. (2001). Literacy in the psychiatric emergency service. Journal Of Nervous And Mental Disease, 189(1), 56-58. Hox, J. (2005). Alfatest. Amsterdam, NL: TT Software. Institute of Medicine (U.S.). Committee on Crossing the Quality Chasm: Adaptation to Mental Health and Addictive Disorders. (2006). Improving the quality of health care for mental and substance-use conditions. Washington, DC: National Academy Press. Joe, G. W., Broome, K. M., Rowan-Szal, G. A., & Simpson, D. D. (2002). Measuring patient attributes and engagement in treatment. Journal Of Substance Abuse Treatment, 22(4), 183-196. Johnson, D. J. (1993). Relationships between oral and written language. School Psychology Review, 22(4), 595-609. Johnson, M. E., Fisher, D. G., Davis, D. C., Cagle, H. H., Rhodes, F., Booth, R., et al. (1996). Assessing reading level of drug users for HIV and AIDS prevention purposes. Aids Education And Prevention, 8(4), 323-334. Kirsch, I. S., Jungeblut, A., Jenkins, L., & Kolstad, A. (2002). Adult literacy in America: A first look at the results of the national adult literacy survey. In U. S. D. o. E. National Center for Educational Statistics (Ed.) (pp. 178): U.S. Government Printing Office, Superintendent of Documents, Washington, DC 20402 (Stock No. 065-000-00588-3). Kutner, M., Greenberg, E., & Baer, J. (2005). A first look at the literacy of America’s adults in the 21st century. In N. C. f. E. Statistics (Ed.): Institute of Education Science, US Dept. of Education. O'Bryant, S. E., Schrimsher, G. W., & O'Jile, J. R. (2005). Discrepancies between self-reported years of education and estimated reading level: Potential implications for neuropsychologists. Applied Neuropsychology, 12(1), 5-11. Parker, R. (2000). Health literacy: A challenge for American patients and their health care providers. Health Promotion International, 15(4), 277-283. Table 5 shows the parameter estimates and their transformation into odds ratios for all effects in the model. For the Item Value effect, statistically significant differences between groups were less likely to be detected for Item Value = 4 than Item Value = 5. For the Reading Ease by Item Value interaction, higher Item values showed a stronger positive effect of Reading Ease indicating that greater item reading difficulty was more likely associated with statistically significant group differences in the percentage of responses for that value. Another way of looking at the interaction results is to graph the predicted values of the Item Value by Reading Ease interaction. Figure 1 shows that for values 3 and 4, increased reading difficulty is related to greater probabilities of detecting group differences while for values 1 and 5, greater difficulty is associated with detecting fewer group differences. Further descriptive analysis indicated that the low education group was more likely to choose value 3 as reading difficulty increased and values 1 and 5 as reading difficulty decreased, while respondents from the higher education group were more likely to pick response 4 as the reading difficulty of the items increased. We would like to thank our colleagues at the Texas Department of State Health Services, Mental Health and Substance Abuse Services Division for their collaborative support of this study, as well as the treatment providers that participated in this study. Presented at the College on Problems of Drug Dependence 68th Annual Meeting, Scottsdale, Arizona, June 20, 2006