Download
1 / 41
420 likes | 608 Views
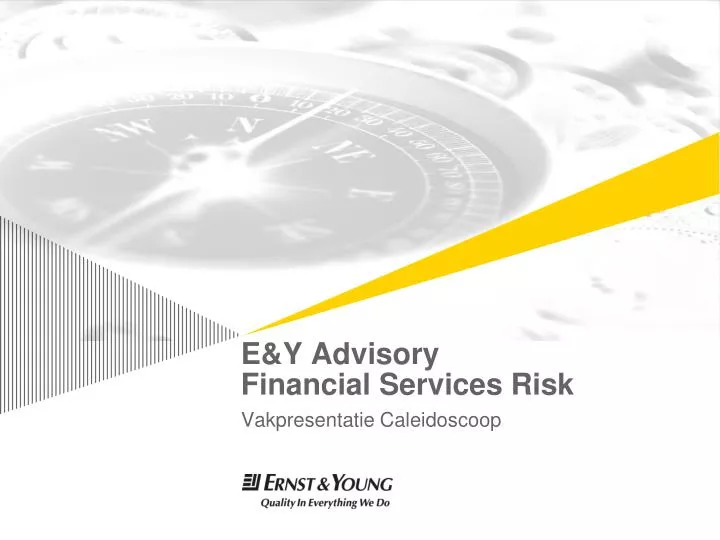
E&Y Advisory Financial Services Risk. Vakpresentatie Caleidoscoop. TexPoint fonts used in EMF. Read the TexPoint manual before you delete this box.: A A. Contacts. Diederik Fokkema diederik.fokkema @ nl.ey.com (088) 407 08 36 Hans Hellemons hans.hellemons @ nl.ey.com

E N D
E&Y AdvisoryFinancial Services Risk Vakpresentatie Caleidoscoop TexPoint fonts used in EMF. Read the TexPoint manual before you delete this box.: AA
Contacts • Diederik Fokkema • diederik.fokkema@nl.ey.com • (088) 407 08 36 • Hans Hellemons • hans.hellemons@nl.ey.com • (088) 407 21 80
Agenda • Introductie • Wie zijn wij? • Wat doen wij? • Wie zoeken wij? • Wat bieden wij? • Terugblik vorige week • Theorie portfolio optimalisatie • Opdracht uitwerken • Bank balans optimalisatie
Wie zijn wij? – Ernst & Young • Aantal medewerkers in NL: 4.600 • 56% man, 44% vrouw • Gemiddelde leeftijd 34 jaar • Aantal locaties: 15 • Hoofdkantoor: Rotterdam Boompjes • Assurance, Advisory, Tax, Transactions
Wie zijn wij? – Advisory Risk BeNe FS Risk Financial Clients
Wie zijn wij? – FSRisk • FSRisk bestaat uit ± 55 collega’s • Standplaats kantoor Amsterdam • Lokaal team met een internationale oriëntatie • Jong, ambitieus en snel groeiend team • Staat bekend om: • Kennisgericht • Kwaliteitsgericht • No-nonsense • … en een grote verscheidenheid aan competenties
Wie zijn wij? – FSRisk - quant Achtergrond • Econometrie, wiskunde, statistiek, BWI, natuurkunde, scheikunde en (bedrijfs)economie • Gezonde affiniteit met de financiële wereld Uitdagingen • Je kennis gebruiken op nieuwe terreinen • Een schakel zijn bij grote projecten • Commerciële en communicatieve vaardigheden ontwikkelen
Vermogens beheerders RetailBanking Verzekeraars Pensioen fondsen (Commodity) Traders FSRisk KLANTEN Market Makers WholesaleBanking Energie bedrijven Vastgoed investeerders Treasury bij Corporates en Non-profit Overige financials Wat doen wij? - Klanten
Wie zoeken wij? – ‘de beste mensen’ De FSRisk’er is: • Ondernemend • Ambitieus • Innovatief & creatief • Communicatief sterk • Team speler • Vaktechnisch sterk
Programma • Terugblik naar vorige week • Terminologie rondom portfolio optimalisatie • Excel demo • Bank balans optimalisatie • Probleemstelling • Wiskundige problemen • CVaR optimalisatie
Terugblik vorige week • Portfolio optimalisatie • “Het toewijzen van kapitaal aan een portfolio van activa (e.g., aandelen) om zo de winst te maximaliseren en/of het risico te minimaliseren.” • Terminologie • Mean-variance portfolio optimization • Efficientfrontier
Terugblik vorige week: terminologie • Consider a portfolio consisting of n assets. The weights to each asset is given by a decision vector , , with being the position in asset iand • The returns on the assets are denoted by a random vector , such that represents the return on asset i. Consequently, the expected rates of returns are defined as and the expected portfolio return equals
Terugblik vorige week: terminologie • The variance of the return on asset i (i.e., the variance of a random variable) is given by • And the covariance between asset i and j is defined as
Terugblikvorige week: terminologie • Subsequently, the variance of a portfolio consisting of n assets is given by • Or in matrix notation as , with representing the covariance matrix
Terugblikvorige week: terminologie • An efficient portfolio is defined as an allocation of assets that maximizes the returns for a certain level of risk • Here represents the maximum level of risk. Additionally an extra constraint on the bounds can be addedhere and respectively represent the lower and upper bound
Terugblikvorige week: terminologie • Alternatively, a combination of assets that minimizes the risk for a certain level of return is given by • Here denotes the minimum level of required return
Terugblikvorige week: terminologie • The efficient frontier is defined as a curve that shows all efficient portfolios in a risk-return framework. • First calculate the solution to the optimization where the return is maximized, while ignoring the risk constraint. This gives an upper bound on the expected return, • Secondly, calculate the solution to the optimization where the risk is minimized, while ignoring the return constraint. This gives a lower bound on the expected return, • Finally, the efficient is obtained by solving the last optimization problem (including the risk constraint) for a certain number of required returns on the interval
Terugblik vorige week: opdracht • Excel demo
Bank balans optimalisatie • Portfolio approach for bank balance sheet optimization • Balance sheet is a summary of the financial balances as of a specific date (e.g., end of financial year) • Financial balances include • Assets • Liabilities • Shareholder’s equity • The following should hold: • Total value assets = total value liabilities + shareholder’s equity
Bank balans optimalisatie • A stylized bank’s balance sheet looks as follows
Bank balans optimalisatie • Assets on the balance sheet produce a positive return, whereas liabilities produce a negative return • This is respectively translated to interest income and interest expenses • Shareholder’s equity does not make any return • Now consider the stylized balance sheet as a portfolio consisting of 7 asset instruments and 4 liability instruments (n=11) • Here the decision vector denotes the positions in the optimal portfolio • And each instrument has a certain return, which is denoted by the return vector
Bank balans optimalisatie • Ultimately led to thefollowing non-linear optimization problem • Conditional Value-at-Risk (CVaR) minimization function • Given a confidence level , the conditional expectation of the portfolio losses above the -percentile are minimized (worst-case scenarios) • J is the number of scenarios
Bank balans optimalisatie • Ultimately led to thefollowing non-linear optimization problem • Mean retained earnings ( ) should be higher than expected retained earnings • This constraint is comparable to
Bank balans optimalisatie • Ultimately led to thefollowing non-linear optimization problem • Constraints needed for CVaR optimization objective function, such that only the worst-case scenarios are taken into account • is a complex loss function (explained later)
Bank balans optimalisatie • Ultimately led to thefollowing non-linear optimization problem • The weights to all assets instruments should add up to 1
Bank balans optimalisatie • Ultimately led to thefollowing non-linear optimization problem • The weights to all liability instruments and equity instruments should also add up to 1, such that the balance sheet is in “balance” • Total value assets = total value liabilities + shareholder’s equity
Bank balans optimalisatie • Ultimately led to thefollowing non-linear optimization problem • Constraints on the maximum weight shift per portfolio instrument. • Here denotes the initial portfolio weight for asset i • The lower and upper bounds for the maximum shift are given by • and respectively
Bank balans optimalisatie • Ultimately led to thefollowing non-linear optimization problem • Constraint on the lower and upper bounds for the portfolio weights
Bank balans optimalisatie • Ultimately led to thefollowing non-linear optimization problem • Lower bound is greater than 0
Bank balans optimalisatie • Ultimately led to thefollowing non-linear optimization problem • Banks are subjected to strict regulation, prescribed by the BIS (Bank of International Settlements), such that a bank resistant to several types of risk • Recently the BIS released new regulation, called Basel III • Constraints to comply to Basel III
Bank balans optimalisatie • Most important risk types for banks • Credit risk: the risk of loss arising from the default by a creditor or a counterparty • Market risk: the risk of losses in on and off-balance-sheet positions arising from movements in market prices • Operational risk: the risk of direct or indirect loss resulting from inadequate or failed internal processes, people and systems, or from external events • Liquidity risk: the risk that the bank is unable to meet expected and unexpected current and future cash flows without affecting either daily operations or the financial condition of the firm
Bank balans optimalisatie • Banks are required by regulation (Basel III) to • Keep a certain amount of capital available for credit, market and operational risk • Have a liquidity buffer (consisting of assets that are considered easily converted into cash) available for liquidity risk
Bank balans optimalisatie • Mathematical techniques/difficulties • Creating the scenario set • From January 2003 to December 2012 • Monthly returns (120 scenarios) • Conditional Value-at-Risk optimization for trading portfolio • Dynamic Conditional Correlation (DCC) GARCH model for trading portfolio • Non-linear optimization problem was implemented using in R, software for statistical computing, and optimized using a sequential quadratic programming (SQP) algorithm from NLOPT (a free/open-source library for nonlinear optimization)
Bank balans optimalisatie: CVaR optimization • The model includes daily returns of 10 equity indices (e.g., AEX, NASDAQ, S&P 500) and 5 commodity indices (energy, industrial metals, precious metals, livestock and agriculture) • Each month the trading portfolio had to be optimized • Trading portfolio is subjected to market risk • The risk of losses in positions arising from movements in market prices • Regulation requires banks to hold capital against this market risk • Capital consists of the 10-day 99% Value-at-Risk (VaR) of the trading portfolio
Bank balans optimalisatie: CVaR optimization • 99%-VaR is minimum amount of capital such that, with probability 99%, the loss will not exceed this amount. • VaR measure lacks convexity when calculated using scenarios • 99%-CVaR is the conditional expectation of the losses exceeding the 99%-VaR • CVaR can be optimized by optimization algorithms • By definition: CVaR ≥ VaR
Bank balans optimalisatie: CVaR optimization • CVaR optimization problem Minimize the conditional expectation of the losses above the threshold (i.e., α-VaR level) For each of the J scenarios, the portfolio weights ( ) are multiplied by the returns for a scenario j ( ). The negative of this value is the loss function:This leads to J losses. Where the conditional expectation of the losses greater than threshold are minimized
Bank balans optimalisatie: CVaR optimization • Loss function explained
Bank balans optimalisatie: CVaR optimization • The efficient frontier of an optimization for the trading portfolio looks like:
Bank balans optimalisatie: CVaR optimization • The loss function in the final problem is the negative of the following
Bank balans optimalisatie: DCC GARCH model • CVaR optimization was performed for 120 scenarios • Correlation however is not constant over time • DCC GARCH model is capable of measuring correlations over time • First estimate the univariate volatility for each asset • Secondly, construct standardized residuals (i.e., returns divided by conditional standard residuals) • Finally, estimate the correlations between the standardized residuals