Download
1 / 7
70 likes | 155 Views
( 억원 ). 영업이익 ( 좌축 ). (pt). 제약업종지수 ( 우축 ). 2,000. 5,000. 1,500. 4,000. 1,000. 3,000. 500. 0. 2,000. 1Q09. 3Q09. 1Q10. 3Q10. 1Q11. 3Q11. 1Q12. 3Q12. 1Q13F. 3Q13F. 상위 업체 합산 영업이익과 제약업종. ( 십억달러 ). 40. 30. 20. 10. 0. 일본. 영국. 한국. 터키. 호주. 미국. 중국. 인도. 독일. 프랑스. 멕시코.

E N D
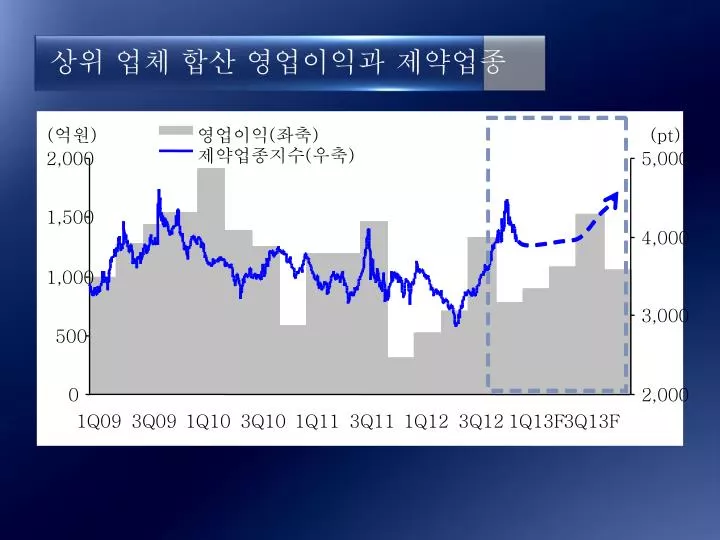
(억원) 영업이익(좌축) (pt) 제약업종지수(우축) 2,000 5,000 1,500 4,000 1,000 3,000 500 0 2,000 1Q09 3Q09 1Q10 3Q10 1Q11 3Q11 1Q12 3Q12 1Q13F 3Q13F 상위 업체 합산 영업이익과 제약업종
(십억달러) 40 30 20 10 0 일본 영국 한국 터키 호주 미국 중국 인도 독일 프랑스 멕시코 브라질 캐나다 러시아 스페인 이탈리아 주요 국가 제네릭 시장 규모
(개,십억원) 업소수 품목수 생산금액 업소 당 평균 생산금액 2001 405 18,439 7,691 19 2002 506 20,693 8,428 19 2003 528 22,014 8,742 17 2004 553 22,356 9,637 17 2005 546 23,374 10,599 17 2006 570 25,589 11,473 19 2007 589 26,067 12,598 20 2008 587 25,118 13,894 21 2009 580 25,362 14,788 24 2010 656 25,534 15,710 25 의약품 생산 실적과 업소 수
(개,십억원) 업소수 품목수 생산금액 업소 당 평균 생산금액 2001 405 18,439 7,691 19 2002 506 20,693 8,428 19 2003 528 22,014 8,742 17 2004 553 22,356 9,637 17 2005 546 23,374 10,599 17 2006 570 25,589 11,473 19 2007 589 26,067 12,598 20 2008 587 25,118 13,894 21 2009 580 25,362 14,788 24 2010 656 25,534 15,710 25 의약품 생산 실적과 업소 수
(개,십억원) 업소수 품목수 생산금액 업소 당 평균 생산금액 2001 405 18,439 7,691 19 2002 506 20,693 8,428 19 2003 528 22,014 8,742 17 2004 553 22,356 9,637 17 2005 546 23,374 10,599 17 2006 570 25,589 11,473 19 2007 589 26,067 12,598 20 2008 587 25,118 13,894 21 2009 580 25,362 14,788 24 2010 656 25,534 15,710 25 의약품 생산 실적과 업소 수