Download
1 / 17
170 likes | 274 Views
Decision Support for Investment in Low Carbon Generation. Dalia Patiño-Echeverri Nicholas School of the Environment - Duke University CEDM Advisory Board Meeting June 13, 2011. Carnegie Mellon University. Motivation and Goal.

E N D
Decision Support for Investment in Low Carbon Generation Dalia Patiño-Echeverri Nicholas School of the Environment - Duke University CEDM Advisory Board Meeting June 13, 2011. Carnegie Mellon University
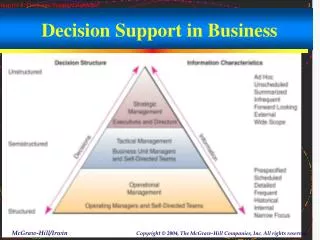
Motivation and Goal • Upcoming EPA regulations for power plants are forcing utilities to invest at a fast pace in retrofits and new units • PUCs are required to assess prudency of these investments but many do not have adequate tools • Some do not have the capability of doing analysis and rely exclusively on utilities input • By engaging a number of PUCs in the development of a “commissioner friendly” Decision Support Tool we may be able to: • Provide an useful tool to help inform PUCs • Learn more about long-term, high-stakes decision making under uncertainty
Objectives • Improve understanding on how PUCs make decisions regarding capital investments under uncertainty • Identify a number of PUCs that can benefit from using an optimization model for investment decisions (OptInvest) • Collaborate closely with a PUC to improve OptInvest • Help PUCs react to utility proposals • Help PUCs assess mechanisms to proactively reduce their ratepayers exposure to GHG regulatory risk • Reflect on usefulness of OptInvest and compare with other approaches
OptInvest: Model description • Stochastic optimization framework to find the best investment and operating decision over a 30+ year horizon considering • Regulatory uncertainty • Fuel price uncertainty • Technology uncertainty (cost & performance) • Best strategy: • Based on Expected cost (Minimize expected costs / Max profits) • Includes risk measure (Constrain accepted variability)
OptInvest: Uncertainty characterization • Assume the future will look like one of several pre-specified scenarios • Different scenarios have different regulations, fuel prices, technology advancement etc.. • Every year a decision is made based on 1)current conditions and 2) the probabilities of all possible future scenarios • n Meta-Model runs assuming reality is each of the n pre-specified scenarios • For each run an optimal strategy for each year of the planning horizon is found
OptInvest: Data Inputs Driver: Policy scenario 2. IECM, NETL, EPA Baseline cost & performance of power plants 1. NI NEMS Prices of: Electricity Fuel Allowances (if any) For each year of the planning horizon 3. OPTIMIZATION MODEL Investment, Operation, Emissions Driver: Natural Gas and Coal scenarios Driver:Technologyscenario
OptInvest: Inputs from decision maker • Drivers of scenarios • Regulation • Fuel • Technology • Probabilities of scenarios • Electric power generation technologies and environmental controls to be considered
OptInvest: Other capabilities • OptInvest helps identify the best investment and operation strategies given decision maker’s characterization of uncertainty It can also be used to: • quantify the cost of mistakes • For example it can be used to assess the cost of ignoring carbon risk in decisions to complying with EPA rules • Assess different policies (to help PUCs be proactive) for example: • a policy that imposes a standard or a fee on new technologies emitting carbon • A policy like NC Clean Smokestacks (SB1078 June 2002) which by requiring NOx and SO2 emissions reductions and the installation of Mercury controls left Duke and Progress unaffected by new EPA regulations. This avoided shortages of electricity and cost escalation due to bottlenecks in permitting, engineering, and construction
Decision Makers • To identify PUCs that can benefit and help from our project we have conducted Meetings/Workshops • North Carolina Utilities Commission (April 11) • The seven commissioners attended a 3 hour long meeting • We can’t help them with modeling but they are interested in a workshop on why models can be helpful • We may approach them again when we have a written report of how OptInvest could have predicted good outcomes of NC Clean Smokestacks Act • Kentucky Public Service Commission (May 9) • We are partners! We will start by conducting analysis for a rate case due on December
Thank you! • Dalia.patino@duke.edu
OptInvest: The cost of ignoring carbon risk • Include scenarios with and without future carbon constraints • Represent two types of decision maker • Carbon Risk Denier Assigns zero probability to every future scenario that includes a constraint on carbon emissions • Carbon Risk Conscious Assigns a non zero probability to scenarios including carbon constraints • Run model for both types of decision maker and compare results • Depending on the scenarios and probabilities, the expected value of costs for the carbon risk denier are 10%-25% higher
Cost of ignoring carbon risk • Assume we know that uncertainty on carbon regulations will be resolved in year 2020, and reality is scenario 2 • Assume Carbon-Risk-Conscious Investor believes: • There are 12 scenarios, 9 of them include carbon constraints (in yellow) • Scenarios are equally likely • Probabilities matrix is:
Scenario 2008 2009 2010 2011 2012 2013 2014 2015 2016 2017 2018 2019 2020 Low NG, no 0.333 0.389 0.444 0.500 0.556 0.611 0.667 0.722 0.778 0.833 0.889 0.944 0 GHG cap Low NG, 0 0 0 0 0 0 0 0 0 0 0 0 1 50% S.280 Low NG, 0 0 0 0 0 0 0 0 0 0 0 0 0 S.280 Low NG, 0 0 0 0 0 0 0 0 0 0 0 0 0 150% S.280 Mid NG, no 0.333 0.444 0.500 0.556 0.611 0.667 0.722 0.778 0.833 0.889 0.944 0 0.389 GHG cap Mid NG, 50% 0 0 0 0 0 0 0 0 0 0 0 0 0 S.280 Mid NG, 0 0 0 0 0 0 0 0 0 0 0 0 0 S.280 Mid NG, 0 0 0 0 0 0 0 0 0 0 0 0 0 150% S.280 High NG, no 0.333 0.306 0.278 0.250 0.222 0.194 0.167 0.139 0.111 0.083 0.056 0.028 0 GHG cap High NG, 0 0 0 0 0 0 0 0 0 0 0 0 0 50% S.280 High NG, 0 0 0 0 0 0 0 0 0 0 0 0 0 S.280 High NG, 0 0 0 0 0 0 0 0 0 0 0 0 0 150% S.280 Cost of ignoring carbon risk • Assume we know that uncertainty on carbon regulations will be resolved in year 2020, and reality is scenario 2 • Assume Carbon-Risk-Denier Investor believes: • There are only 4 scenarios, none of them includes carbon constraints (in yellow) • Scenarios are equally likely • Probabilities matrix is:
Cost of Ignoring Regulatory Risk: Scenario 2 Capital Costs 2011 – 2025 Account for carbon: • 1 investment • Capital investment NGCC 2012: NPV $456 million Ignore carbon risk: • 4 investments • Capital investments 3 retrofits + NGCC: NPV $593 million