Download

1 / 16
160 likes | 312 Views
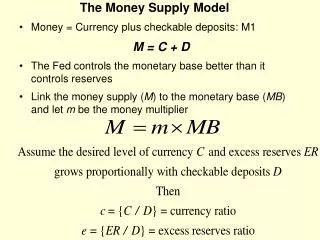
The DWP Labour Supply Model. Elisa Baroni* DISCLAIMER: This presentation reflects the views of the author only. NOT FOR QUOTATION. Model Rationale . To build in-house capability to analyse behavioural responses to changes to benefit system, in particular to in-work benefits

E N D
The DWP Labour Supply Model Elisa Baroni* DISCLAIMER: This presentation reflects the views of the author only. NOT FOR QUOTATION
Model Rationale • To build in-house capability to analyse behavioural responses to changes to benefit system, in particular to in-work benefits • To monitor progress against PSA targets as well as set realistic new targets for future
Key DWP Targets • Reduce by 6.5% the number of children in workless HH by 2006 • Halving children in low income households by 2010. • Increase employment rates of lone parents, people > 50, disabled etc. by 2006 • Reduce the unemployment rate over the economic cycle by 2006 • Other
AIMS of LSM (I) To estimate if/how financial incentives affect labour market transitions (i.e. the probability of flowing in and out of work), by different family types (ii) To simulate how changes to financial incentives (through the tax and benefit system) affect such transition probabilities, hence employment levels, using DWP static micro-simulation model
The Data • The estimation model (IFS) matches 2 UK national surveys (1997-2002) • The FRS: cross-sectional, 26,000 HH, income information • The LFS: short-panel, 60,000 HH, employment information • The simulation model (DWP) uses FRS(0203) on PSM(0405) by merging in estimated coefficients
The sample • Working Age People between 20 and 55 • Exclude full time students, pensioners, self-employed, long term sick and disabled
The LSM Structure • Simulates predicted wages, hours, childcare costs • On the basis of alternative assumptions about employment of single/couples, and take up of WTC, produces budget sets • Simulates expected take up of WTC • Simulates expected labour supply at t given labour supply at t-1 • Repeats 2-4 under a reform proposal • Tabulates short term and long term impact on employment stocks
The model estimates 6 transitions probabilities based on initial work status at t-1: 2 * singles = P(Entry) and P(Exit): P(Li,t = k| Li,t–1 = K) = f (Xi,t , Y0,t , Y1,t) for k={0,1} Estimated by Probit 4 *Couples (joint decision) = P(Entry) and P(Exit) of Male, Female or both: P(Lj,t = k| Lj,t–1 = K) = f (Xj,t , Y1k,t, Y2k,t, Y3k,t, Y4k,t ) for k=(0,0), (0,1), (1,0), (1,1) Estimated by Multinomial Logit
Calculating Net Incomes Y • The model hinges on the ability to accurately simulate net income Y in each labour market status k, given a tax and benefit system T. • 3 main stages: • Estimation of the parameters used as inputs for modelling financial incentives: hourly wages (entry and exit) and hours for everyone in the sample, childcare costs for those with children. Yk = ƒ (h,w,T,CC)
Calculating Net Incomes Y 2. Tax and Benefit Calculation: PSM is run 11 times to calculate disposable incomes Y under T: • under each of 6 labour market states (2*singles + 4*couples) • under 3 take up assumptions for WTC (0%, 100%, 100% with 0% childcare subsidy) for each state k 3. Modelling take up of in-work benefits and paid childcare. • So for given T, final expected Yk : Yk = YnoWTC + [YWTCnoCC + (YWTCwithCC - YWTCnoCC)*Pcc -YnoWTC]*PWTC - CC*Pcc
LSM Simulations • The PSM allows to repeat the calculation of net incomes Yk under a base and an alternative tax and benefit system, Tb and Ta (after a policy reform) • This allows to then estimate the change in transition probabilities between Tb and Ta , by family type. • The model then calculates short and long run labour supply effects due to changes from Tb to Ta by comparing the difference in the relative employment stocks, disaggregated by gender, marital status and children.
LSM Simulations • The short run employment stock is the difference in the number of employed people between time t-1 and t (5 quarters) e.g. Lsr = (in-workt-1)*(1-ProbExiting) + (out-of-workt-1)*ProbEntering • The long run employment stock is the “equilibrium level” at t+k and is reached by iterating Lsr until it remains constant • The difference in stocks (SR or LR) between the “base” and the “reform” T scenarios represents the labour supply effect of that reform
Results of IFS Estimation • Estimation results show that financial incentives are generally significant in explaining flows in and out of work (P), and have the expected sign. • Working singles seem to be more sensitive to changes in financial incentives than workless singles.
Results of LSM simulations • Test simulations show that the larger labour supply effects from changes to in-work benefits (changing T) come from single parents, as expected. However effects are quite small. • In particular, increases to in-work benefits tend to increase the labour supply of singles / lone parents, while they tend to decrease participation by couples.
Future Developments • Improving calculation of wages / add stochastic component to expand the distribution • Include disabled and ability to model their financial incentives • Model non-participation vs. unemployment • Re-estimate parameters