Download
1 / 20
210 likes | 348 Views
Global Test Statistic to Assess a Treatment Effect on Multiple Outcomes. Mei Lu, Ph.D. Dept. of Biostatistics & Research Epidemiology. Outline. -Motivations -Quasi-likelihood vs. likelihood estimation -Working correlation matrix - Applications -Summary.

E N D
Global Test Statistic to Assess a Treatment Effect on Multiple Outcomes Mei Lu, Ph.D. Dept. of Biostatistics & Research Epidemiology DOE July 9-13 2006
Outline -Motivations -Quasi-likelihood vs. likelihood estimation -Working correlation matrix -Applications -Summary DOE July 9-13 2006
Motivation: NINDS t-PA Stroke Trials National Institute of Neurological Disorders and Stroke (NINDS), NIH Coordinating Center at Henry Ford Health System for data collection, management, and analysis 8 clinical centers participated and 43 hospitals involved in patients enrollments (USA) DOE July 9-13 2006
Trial Design/Treatment • Design • Phase II/III, double-blind, and placebo-controlled - Stratified randomization by time, 0-90 and 91-180 minutes of the stroke onset, and by clinical centers • Treatment of t-PA/Placebo • Dose .9 mg/kg (estimated body wgt.) • Max. dose 90mg, 10% bolus, remainder over 60 minutes DOE July 9-13 2006
Trial Design/Endpoints • Part 1: t-PA Activity (primary) • Early clinical improvement at 24 hours after stroke • Part 2: t-PA efficacy (primary) • Hypothesis: there is t-PA effect on stroke recovery at 3 months • The stroke recovery is defined as a set of binary outcomes • Barthel > 95 • Rankin of 0 or 1 (“no significant disability or symptoms”) • Glasgow of 1 (good recovery) • NIHSS of 0 or 1 DOE July 9-13 2006
Motivation: Animal Stroke Model • Design: rats, subjected to stroke, received various doses of MSCs/PBS at 24h after stroke, and had the functional assessments completed at 14 days after stroke. • Hypothesis: there is MSCs effect on stroke recovery • The stroke recovery was measured from three • functional tests and they have continues outcomes • Adhesive-Removal patch test, • Rotarod test and • mNSS DOE July 9-13 2006
Treatment groups Measurements A Subjects, i = 1,…,n B C Randomize Correlated Outcomes “Repeated measures”/Cluster data: same subject, same measure and successive times, or same subject with multiple endpoints DOE July 9-13 2006
Generalized linear model (GLM) DOE July 9-13 2006
Generalized Estimating Equations (GEE) , where V is a known function (working variance matrix) and is scale parameter (the over dispersion parameter) • Quasi-score depends on Yi only through its mean and variance • Yi are not necessary to be specified as normal DOE July 9-13 2006
GEE vs. GLM or MIXEDin SAS • vs. var(Yi) • GLM or MIXED in SAS --- MLE assuming that Yi is normal • GEE---Quasi LE (QLE) assuming that var(Yi) is function of i • QLE=MLE if only if V is the true covariance of Yi DOE July 9-13 2006
Correlation For unit i 1. Independent: Vi is diagonal 2. Exchangeable: All measurements on the same unit are equally correlated 3. Unstructured correlation:no assumptions about the correlations DOE July 9-13 2006
Applications- Global test for a treatment effect on multiple endpoints Design: Software: Proc GENMOD SAS 9.0 or GEE Macro 2.0 DOE July 9-13 2006
Properties of Global Test • Calculate the global estimate (test statistic) assuming a common dose effect • Take the correlation amount of the outcomes into account • If global test is significant at 0.05 level, treatment effect can be evaluated on each single endpoint at level 0.05 • Power > power of univariate test • Pocock et al. Biometrics 1987 DOE July 9-13 2006
Sample Size/Power Calculation • The global test is more efficient than a single outcome if outcomes are correlated in the same direction (Legler et al., 1995) -Legler JM, Lefkopoulou M, Ryan L. Efficiency and power of tests for multiple binary outcomes. JASA 90[430], 680-693. 1995. • Diggle, Liang and Zeger (1994) -Analysis of Longitudinal Data. Clarendon Press, Oxford. DOE July 9-13 2006
Global Test for NINDS t-PA Trials Hypothesis: there is a t-PA treatment effect on stroke recovery, measured from four binary outcomes Four (4) binary endpoints were collected on each subject to measure the stroke recovery with 312 patients in Part 2 and 291 in Part 1. Link function as logit and variance as binominal with unspecified covariance structure using GEE National Institute of Neurological Disorders and Stroke rt-PA Stroke Study Group. ‘Tissue plasminogen activator for acute ischemic stroke’, New England Journal of Medicine,333, 1581-1587 (1995). DOE July 9-13 2006
Global Test for Animal Stroke Model • Hypothesis: there is MSCs effect on stroke recovery, measured from three functional tests (continue outcomes), Adhesive-Removal patch test, Rotarod test and mNSS • Rats, subjected to stroke, were randomized into one of three groups (0 MSCs/BPS, 1x10⁶ MSCs and 3x10⁶ MSCs) at 24h after stroke • -Lu M, Chen J, Lu D, Yi L, Mahmood A, Chopp M. Global test statistics for treatment effect of stroke and traumatic brain injury in rats with administration of bone marrow stromal cells. J Neurosci Methods 2003; 128(1-2):183-190. DOE July 9-13 2006
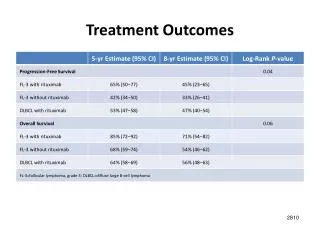
Global Test for Animal Stroke Model • Before conducting the global test, we need to do the following: • - Check the consistency of the outcome scoring • Standardize the outcomes • *significant improvement on functional recovery compared to controls based on the global test; #p=0.06, marginal differences on functional recovery between MSC dose 1 x 10⁶ and 3 x 10⁶ DOE July 9-13 2006
Summary • Global test statistics can assess the common treatment effect on multiple correlated outcomes. • Global test is an efficient test statistic when outcomes are consistent and correlated in a same direction. The less correlation, the more power, therefore the higher efficiency • Before using the global test, check consistency of the outcomes and re-scaled outcomes if they are continuous. DOE July 9-13 2006
Summary • GEE vs. GLM • -use GLM when data are normal • -GEE has a more robust estimation, when data are not normal • Do not use GEE • for conditional logistic regression (family data ) • If there is negative correlation among the outcomes (e.g.,30%? or more) DOE July 9-13 2006