Download
1 / 16
160 likes | 274 Views
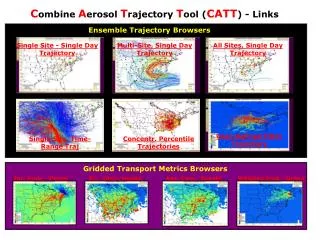
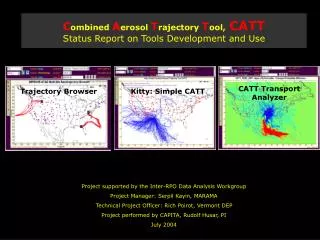
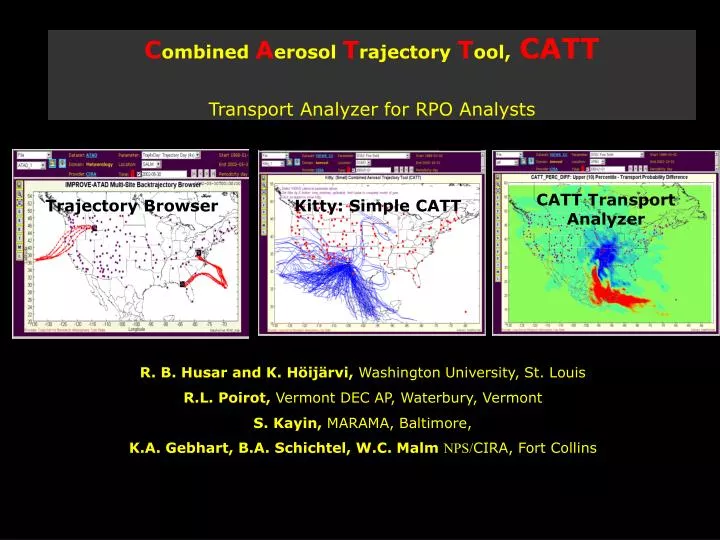
C ombined A erosol T rajectory T ool, CATT Transport Analyzer for RPO Analysts. CATT Transport Analyzer. Trajectory Browser. Kitty: Simple CATT. R. B. Husar and K. Höijärvi, Washington University, St. Louis R.L. Poirot, Vermont DEC AP, Waterbury, Vermont S. Kayin, MARAMA, Baltimore,

E N D
Combined Aerosol Trajectory Tool,CATTTransport Analyzer for RPO Analysts CATT Transport Analyzer Trajectory Browser Kitty: Simple CATT R. B. Husar and K. Höijärvi, Washington University, St. Louis R.L. Poirot, Vermont DEC AP, Waterbury, Vermont S. Kayin, MARAMA, Baltimore, K.A. Gebhart, B.A. Schichtel, W.C. Malm NPS/CIRA, Fort Collins
Acknowledgements • The CATT Tool is the result of an effective CIRA-CAPITA collaboration to create a sequential value-adding chain. CIRA has opened the VIEWS and the ATAD databases for use by CAPITA. In fact the current CATT ensemble trajectory browser is accessing the VIEWS database for chemical data in real time! CAPITA added the trajectory browser code and the user interface. • The result is a textbook illustration of the new distributed computing paradigm! It is hoped that the values that the CATT project added to the chain will be accessed and utilized by others and continue the value-adding process. The opportunities for mutual empowerment are truly endless • The functionality of CATT was strongly influenced by the dynamic infusion of ideas from Rich Poirot. Beyond setting the initial goal of the CATT-Tool project, he also supplied continuous feedback on both the initial CATT design as well as on other features that we have added for our own reasons. • Serpil Kayin of MARAMA made sure that we actually finished this un-finishable 'project'. • The entire DataFed/CATT code was written by Kari Höijärvi of CAPITA
AEROSOL CATT-In CAPITA Aerosol Sensors Aerosol Data Integrated AerData TrajData Cube Aggreg.Aerosol Collection IMP. EPA Trajectory ARL Integration VIEWS Assimilate NWS CATT Weather Data Gridded Meteor. Traject.Data When? Where? Aggreg. Traject. Next Process AerData Cube CATT-In CAPITA Not There! Why? How? TRANSPORT Further Analysis Next Process GIS Grid Processing Emission Comparison There! CATT: A Community Tool! Part of an Analysis Value Chain
Chemical Filter Tool Trajectory Aggregator Tool CATT Components Trajectory Aggregator Tool (TAT).Receives date-location pairs Performs the trajectory extraction Aggregation (e.g. residence time) Outputs spatial transport pattern Chemical Filter Tool (CFT). Queries to chemical data sets. Outputs “qualified” date-location pairs.
IMPROVE-ATAD Trajectory Browser Tool • Backtrajectory browser for IMPROVE sampling sites. Click on location and date. http://webapps.datafed.net/dvoy_services/datafed.aspx?view=atad • Fir a given sampling date, the backtrajectories for multiple receptor sites can be retrieved. The sites are specified in the URL, e.g.:
Trajectory Weights: Concentration & Age Uncertainty potential further away
Kitty – Simple CATT • All the VIEWS chemical parameters available for filtering Guadalupe Soilf > 5
Fine SOIL transport at decreasing concentration limit Dust > 30 ug/m3 Dust > 15 ug/m3 Dust > 7.5 ug/m3 Dust > 3.7 ug/m3 Dust > 1.8 ug/m3 Dust > 1.8 ug/m3 Weight by 1 Calc high Percent days
Incremental Transport Probability Analysis (Poirot) Backtrajectories for all days, Jun, Jul, Aug Backtrajectories for top 10 percentile Soil, Jun, Jul, Aug Upper Buffalo IMPROVE Site • Red - regions of high transport probability • Blue - regions of low transport probability A B Incremental Transport Probability, Jun, Jul, Aug • Trajectories for top 10 percent SOILf are calculated • Trajectories for all days are calculated • Trajectory endpoints gridded (A-B)
Big Bend Incremental Probability MapsUpper 10 percentile,Big Bend, Jun, Jul Aug • Incremental Transport for Big Bend indicate southerly transport of species, except sulfate • Conspicuously, in the summer, nitrate is also transported from the south PMFine ammSO4 SOILf OCf ECf ammNO3
Brigantine Incremental Probability MapsUpper 10 percentile,Brigantine, Jun, Jul Aug Incremental Transport Probabilities for Brigantine indicate westerly transport of species Soil is preferentially transported from southwest; nitrate is transported from the northwest PMFine PMFine ammSO4 SOILf OCf ECf ammNO3
CATT Status: • Trajectory Browser, Aggregator, Kitty is functional now • Full CATT ready for testing/tutorial/use in November • CATT Future: • Add Additional Ensemble Trajectory Metrics • Update as new Traj & Aerosol data (Kristi Gebhart has just updated ATADs to 2003 • Add more aerosol (STN) & trajectory data (Kristi cranked out ATADs for STN– triple site density)!! • Continue cooperation of RPOs with & other DataFed.Net Partners (NSF, NASA, EPA, etc.)