Download
1 / 9
90 likes | 198 Views
Methane Lifetime in CMIP5 simulations. Arlene M. Fiore. Jasmin John, Vaishali Naik , Larry Horowitz (GFDL) Jean-François Lamarque (NCAR). NCAR CESM Chemistry-Climate Working Group Meeting Breckenridge, CO June 21, 2011.

E N D
Methane Lifetime in CMIP5 simulations Arlene M. Fiore Jasmin John, VaishaliNaik, Larry Horowitz (GFDL) Jean-François Lamarque (NCAR) NCAR CESM Chemistry-Climate Working Group Meeting Breckenridge, CO June 21, 2011
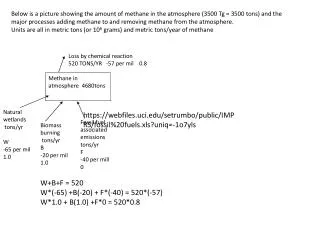
Both climate and emissions exert controls on evolution of methane lifetime tCH4 = tCH4 SHORTENS WITH INCREASING: • 80-90 % of tropospheric methane loss by OH occurs below 500 mb • ~75% occurs in the tropics • [Spivakovsky et al., JGR, 2000; Lawrence et al., ACP 2001; Fiore et al., JGR, 2008] • temperature (by 2% K-1) • [OH] • + NOx sources (anthrop., lightning, fires, soils) • + water vapor (e.g., with rising temperature) • + photolysis rates (JO1D; e.g., from declining strat O3) • - CO, NMVOC, CH4 (emissions or burden)
NCAR CAM-Chem and GFDL CM3 CMIP5 Simulations 1. CMIP5 (ACC-MIP) anthropogenic forcings and emissions: -- greenhouse gases (GHG) -- emissions of aerosols and tropospheric O3 precursors note: CH4 abundance is prescribed (not emissions) -- ozone-depleting substances (ODS) 2. Meteorology-dependent lightning NOx scheme 3. Climatological isoprene emissions 4. Tropospheric and stratospheric chemistry 5. Historical volcanic eruptions and solar forcing • CM3 [ Donner et al., 2011] • aerosol indirect effect • MOZART-2 mech. (trop) • AMTRAC mech. (strat) • Fully coupled ocean • CAM-Chem[Lamarque et al., 2011] • No indirect effect • reduced mech. (trop) • MOZART-3 mech. (strat) • SSTs from AR-4 (CCSM3)
CMIP5 NOx emissions and CH4 abundances:Impacts on methane lifetime? Anth. NO (Tg yr-1) t NOx OH CH4 t NOx OH CH4 CH4 OH t t t Methane abundance (ppb) RCP4.5: CH4 OH RCP8.5: CH4 OH CH4 1. CH4 CH4 3. 2. Figures c/o V. Naik
CAM-Chem and GFDL CM3 models both project increases in methane lifetime under RCP8.5 GFDL CM3 RCP8.5 (years) CAM-Chem RCP8.5 (SSTs from SRES A2) t CH4 2081-2100 vs. 2006-2025: +8.6% CAM-Chem+4.3% GFDL CM3 t NOx + CH4 + strat. O3 OH CH4
Methane lifetime evolution less consistent under other RCPs, e.g. RCP4.5 GFDL CM3 RCP4.5 CAM-Chem RCP4.5 (SSTs from SRES B1) (years) t CH4 2081-2100 vs. 2006-2025: -2.6% CAM-Chem-13% GFDL CM3 • More warming in CM3 than CAM-Chem? • Role of aerosol indirect effect in CM3 response?
Historical (1850-2005) evolution of methane lifetime:CAM-Chem & CM3 differ in sign; CM3 increase is anthrop. Both models show downward trend in recent decades: warming (T, H2O) Tropospheric CH4 lifetime (years) t • +5% CM3 Historical • +5% CM3 Anthro. Forcings only CH4 1986-2000 vs. 1861-1880: -10% CAM-Chem Historical GFDL ACC-MIP 2000 emissions + 1860(SST+ODS+GHG) - ACC-MIP 1860 = -13% decrease in CH4 lifetime • 1. Trop O3 and aerosol precursor emission changes decrease lifetime (NOx) • 2. Increasing SSTs and ODS over historical should also decrease lifetime • Implies a role for GHG (incl. CH4) in CM3 historical increase, • though NOx + temperature rise “wins” in CAM-Chem
Tropical OH decreases 1910-1970 role of declining photolysis rates 1940-1970? OH (1x10⁵molec cm-3; 30S-30N) Next steps: Examine role of -- JO1D, lightning NOx on OH -- aerosols vs. strat O3 on JO1D • CM3 Historical • CM3 Anthro. Forcings only JO1D (x105 s-1; 30S-30N; below 500 hPa) Strat O3 column (DU; 30S-30N)
Concluding thoughts: Key drivers on methane lifetimes in CMIP5 simulations • NCAR and GFDL models differ in terms of driving role for emissions of short-lived species vs. “climate”. ACC-MIP should aid in interpreting relative roles • Multiple, sometimes offsetting influences from water vapor, photolysis rates, OH precursor emissions (natural and anthropogenic), temperature. • Roles of stratospheric chemistry, aerosol-cloud interactions, and associated climate responses, require further investigation. Need carefully designed simulations for attribution Observational constraints from historical period?