Download
1 / 16
160 likes | 265 Views
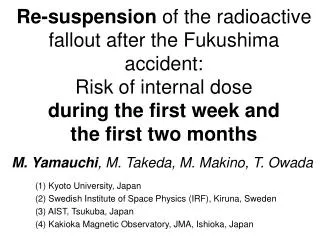
Radioactive contamination processes during 14-21 March after the Fukushima accident: What does atmospheric electric field measurements tell us?. M. Takeda 1 , M. Yamauchi 2 , M. Makino 3 , T. Owada 4 , and I. Miyagi 3. (1) Kyoto University, Japan

E N D
Radioactive contamination processes during 14-21 March after the Fukushima accident: What does atmospheric electric field measurements tell us? M. Takeda1, M. Yamauchi2, M. Makino3, T. Owada4, and I. Miyagi3 (1) Kyoto University, Japan (2) Swedish Institute of Space Physics (IRF), Kiruna, Sweden (3) National Institute of Advanced Industrial Science and Technology, Tsukuba, Japan (4) Kakioka Magnetic Observatory, Japan Meteorological Agency, Ishioka, Japan EGU2012-342 (XL355, 2012-4-25)
Total release: 1017 Bq for 131I & 1016 Bq for 137Cs ~ 15% of Chernobyl Accident over > 100 km radioactive plumes
Large-scale monitor & combine PG (Fig.2 & 5) Detection principle Confirm dosimeter result Estimate initial I/Cs ratio Ion density n: dn/dt = q - αn2 - βnN Figure 1: Three different types of measurements Figure 2: Radiation from the radioactive dust (grey hatched area) increases ion density (~ electric conductivity), re-distributing potential drop between the ionosphere (200 kV) and ground (0 V) to the higher altitude. Blue dashed lines denotes equi-potential surfaces.
Tucson, 1952 Figure 3: (a) Red: downward atmospheric electric field (PG) at Kakioka measured by in-house sensor. The data gap (11-13 March) is due to the power failure. Blue: rainfall at Kakioka. (b) Radiation dose rate at the nearest location from Kakioka(cf. Fig 5 for location).PG dropped to near-zero (ion density increase by more than factor 10) twice, at 14 March and at 20 March (green arrows). Radiation dose rate and the PG show independent behavior. Rain 24 hours Helsinki, 1986 Rain 2 weeks Figure 4: PG drops after nuclear test (Harris, 1955) and Chernobyl Accident (Tuomi, 1988)
Figure 6: Since PG reflects altitude distribution of the ion, the same radiation dose level gives different PG for different forms of radioactive contamination (black area). Inversely, contamination form can be estimated from the combination of PG and dose rate. Figure 5: Locations of the failed Fukushima Dai-ichi Nuclear Power Plant (FNPP-1), Kakioka (about 150 km SSW), and other measurements.
Figure 7: Activity of nuclear reactor (a) (b) (a) PG at Kakioka. (b) radiation dose rate. No rain at Kakioka except 20 UT on 15 March. The PG-drop at 21 UT on 14 March is traced back to the increase of the dose rate at 20 UT (Mito), 19 UT (Kitaibaraki), and 17 UT at Dai-ni, as indicated by light-red arrows(cf. Fig 5 for location). However, on 16 March, the PG increased after 2 UT when the first strong wind (> 5 m/s in average) blew although the radiation dose rate at Mito increased. The finite PG continued afterward (20-30 V/m). The backup instrument showed the same PG pattern. Wind most likely brought radioactive material to few km, to re-redistribute the PG.
Figure 8: (a) (b) (a) PG and rainfall at Kakioka. (b) radiation dose rate and rainfall at Mito (cf. Fig 5 for location). Final settlement to PG = 0 V/m after the first substantial rain on 20-21 March Ions (i.e., source of the ionizing radiation) at higher altitude are removed by the rain (cf. Fig 6). Slightly before the rain, large radioactive plume arrived (light-red arrow) carried by strong wing blew from the northeast (the direction of the FNPP-1). The plume simply passed above, but the rain deposited substantial mount to the surface, resulting a jump of the radiation dose rate from 0.2 µGy/h to 0.4 µGy/h. Such a jump is also seen at 2 UT on 20 March, but the amount of this dry deposition is very little.
More about plumes soil sampling initial I/Cs ratio exponential decay = 8-day as expected Figure 9: soil sample data are classified into different regions.
Figure 11 Figure 10 Faster decay at Takahagi is due to higher I/Cs ratio. Combining with the soil sampling data (Fig. 9) which shows the same I/Cs ratio between Hirono and Iwaki (Iwaki has the same decay rate as Kitaibaraki), the plume on 20 March had different I/Cs ratio between it east part (red route in Fig. 11) and west part (orange route in Fig. 11) . Thus the data can even show the internal structure of the plume.
Other features in Fig. 3 Daily variation of PG in sunny days (purple arrows in Figs. 3 and 12) disappear and recover, and disappear again (yellow allows in Fig. 3). The peak at local noon (Fig.12) means that the driver is daily convection. The disappearance is simultaneous with the reset of baseline PG new deposition, either from trees or from the FNPP-1. 134,137Cs Figure 12 • Resetting ceased end of April • There are minor plumes from FNPP-1 until summer 2011, but they are not visible in the PG data al. • Increase of PG during 23-24 April ? 131,132I Figure 13: Low PG even after 1 year because ofradiocesium (half-life is 134Cs = 2 yr, 137Cs = 30 yr).
Figure 14 Summary:Combination of Atmospheric Electric field (PG) data and radiation dose rate data showed that the major southward depositions took place twice, dry one on 14 March, and wet one on 20-21 March. Even the latter one did not settle the radioactive materials as firmly as the Chernobyl case, causing re-suspension afterward.
Kakioka's PG & Radiation dose rate data at different places are compared to study the radioactive deposition processes. • PG data give independent information from the radiation dose rate data. • Dry deposition on 14 March was driven by the surface wind, leaving radioactive materials suspended above the surface (= can easily be lifted up). • Wet deposition on 20 March washed the suspended radioactive down to the surface. • Wet deposition does not mean firm settlement (= can be re-suspended by wind). • It is recommended that all nuclear power plant to have a network of PG observation surrounding the plant. • Combination of soil sampling and radiation dose rate revealed I/Cs ratio gradient in a single plume Summary
We derive spread & deposit of Radioactive materials from available data • Strong public demand to scientists on spread & deposit of the radioactive materials to protect their health (internal dose problem). • Accident took place in a dense network of measurements, producing a vast data first time in history (new research field). • Estimating particle motion from multi-instrument / multi-point measurements is a geoscience problem (our duty as geoscientist). • Urgently needed task.
CTBT Takasaki-station After May 2011 Minor re-suspension (release) from the FNPP-1 continued even June 2011
2011-3-14 (00 UT) 2011-3-15 (00 UT) 2011-3-16 (00 UT) 2011-3-20 (00 UT) 2011-3-21 (00 UT)


![1. 400 m 2. 200(1 + p ) m 3. 200[1 + ( p /2)] m 4. 200[1 + ( p /4)] m 5. zero](https://cdn3.slideserve.com/5442402/slide1-dt.jpg)