Download
1 / 16
160 likes | 316 Views
Status of Joint Implementation. Jari Vayrynen World Bank Carbon Finance Business Host Country Committee Washington 15 February, 2005. Content of presentation. Overview of current status Interaction between JI and EU ETS Track One JI: how could it be done?

E N D
Status of Joint Implementation Jari Vayrynen World Bank Carbon Finance Business Host Country Committee Washington 15 February, 2005
Content of presentation • Overview of current status • Interaction between JI and EU ETS • Track One JI: how could it be done? • World Bank’s role in Greening of AAUs
Role of Joint Implementation less than expected? • Has received muss less international attention than CDM • International Emission Trading could be more attractive • All countries expected to meet eligibility requirements for trading by 2008 • In EU countries ETS often easier route
Interference with the EU ETS • Uncertainties around the NAPs has delayed decisions on projects • Limits the JI opportunity: • For many covered installations EU ETS simple and more attractive • Treatment of indirect emission reductions/double counting still unclear: • EU Commission Guidance by end of 2005? • The increased risk for JI buyers could be mitigated through LoAs that cover cancellation of EUAs by: • The operator (for directly covered installations) from its EUA account • The Government (for indirect ERs) from the national registry
Why would anyone do JI in EU countries (current or accession)? • Gases not covered in ETS • Uncertainty on 2005-2007 EUA prices and 2008-2012 allocation of EUAs • JI baselines may give more ERs to sell than EU ETS: • “Fix” a baseline to which project emission compared through 2012 • This baseline likely higher than the EU Allowances would get for the 2008-2012 period • JI contracts longer term and larger volumes (but so far lower prices) • Bigger market with Japan and Canada
“STAY IN ETS” Emissions JI Baseline Grandfathered ?? 2008 2005 Project
Role of Article 6 Supervisory Committee Unknown • Members, exact mandate, meetings? • Will it adopt most of CDM guidance or something simpler? • Could much more standardized baselines be used? • Is the CDM additionality tool appropriate for JI, e.g.: • evidence on consideration of JI before start of project (Step 0) • impact of JI revenue (Step 5)? • Need to move to first track as soon as possible!
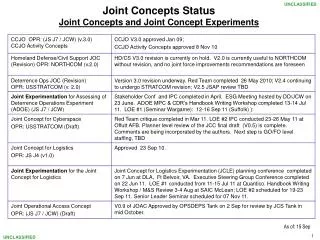
How could Track One JI be done? • ERUs only in 2008-2012, but project generate ERs even before 2008 • Some flexibility exists for Pre-2008 ERs! • Verification of pre-2008 ERs (for AAUs) therefore an agreement between host and buyer: • Makes sense to apply a procedure similar to Track One JI • Same procedure can be extended to the true Track One JI period of 2008-2012
Track One JI:Where to start? • Use Validated Methods and Projects as Starting Point: • Host Country can simply adopt and stardardize existing methods and use them to verify ERs • Projects prepared using Track Two JI procedure provide a credible basis • Validation (and in some cases Verification) have confirmed eligibility and ERs • Monitoring Reports can be used for host country verification • Host country Verification can be done administratively or using a domestic auditor (e.g. some ETS verifiers?)
Track One: Where to Start? (cont.) • Same Baseline and monitoring methods can be applied to new projects “validated” and verified by host country or in Greening of AAUs • Buyer could retain right to revert back to Track Two JI verification • DNA to coordinate • Project Entity sends Monitoring Report to both buyer and DNA • verification administratively or using an auditing company
‘Excess AAUs’ and Greening • At least 1.5 billion tons of AAUs required to meet targets of OECD countries: • The direct value of the AAU sales could be $10-15 billion. • Overall investment leveraged by these sales can be $50-75 billion over the next 7 years. • “Non-greened” AAUs might not be acceptable to taxpayers in buying countries • Some governments have already announced that they would not purchase unless “greened” • By devoting the proceeds of the sales to ‘green’ investments EITs could make investment in key sectors (e.g. energy, forestry) more attractive
AAU Headroom Estimates Country Annual Headroom Total Headroom (MtCO2e) (MtCO2e) Russian Federation 580-876 2,900-4,380 Ukraine 351-365 1,757-1,825 Poland 81-125 405-627 Romania 81-97 407-486 Bulgaria 57-64 286-322 Lithuania 26-28 130-142 Hungary 14-23 73-118 Latvia 14-15 70-78 Estonia 17-20 86-100 Slovakia 5-12 29-59 Czech Republic 9-25 44-127 Croatia 0-3 (-2)-14 Slovenia (-5)-(-2) (-25)-(-13) Total 1,230 – 1,651 6,160 – 8,265 Source: Emissions data for 2002 (all gases) compiled based on UNFCCC website (ghg.unfccc.int); projections for 2010 based on U.S. DoE (2004) International Energy Outlook 2004 Mid- and Hi- scenarios, and from International Energy Agency (2004) World Energy Outlook 2004; Projections for Russia also based on Lecocq and Shalizi (2004)
Potential Value of the Headroom • Japan, Canada, and Western Europe need hot air to comply with the Kyoto Protocol • Potential demand for outside credits: 2.5 - 3.5 btCO2e • Potential supply of CDM/JI: 0.3 - 1.0 btCO2e Required amount of AAUs: 1.5 - 3.2 btCO2e • Supply (6.2 - 8.2 btCO2e) larger than demand • but there is value in holding AAUs (risk-hedging, banking, monopolistic behavior). • The price thus uncertain: $7-$10 range? • Sale of 2.5 btCO2e could bring 15 – 25 b$ + 3-5 times as much in leveraged investment to ECA
Bank Activities in Greening of AAUs World Bank regional staff and carbon finance team have: • apprised countries of opportunity of Green Investment Schemes • received request for technical assistance from Bulgarian, Czech, Polish, Romanian and Slovak Governments. • Completed Green Investment Scheme initial design for Bulgaria; • Discussed purchase of credits on an informal basis with potential buying countries; • Mobilized some of the funding necessary to carry out additional design work in other countries.
Proposed Activities • Jointly marketing the Green Investment Scheme in the OECD with the Government or Government selected commercial bank • Commercial bank to to lend against the face value of the OECD sovereign purchase commitment • Assist the Government mobilize the financing for the underlying projects. • Examine the use of Bank’s lending and partial risk guarantee instruments to facilitate the financing of the Green Investment Scheme. • Build the capacity of the seller governments to validate, certify and report emissions reductions from the green investments.
Proposal for GIS • Green Investment Scheme (GIS) business development proposal submitted to WB region management in December 2004 • Proposes the launch of GIS in Bulgaria in FY 05 • Initiate a special effort in Russia and Ukraine to study the feasibility of a GIS • Initiate design of GIS in interested countries (Romania, Poland, Czech and Slovak Republic) in FY05 • Allocates $850K from the Carbon Finance Business for these activities