Download
1 / 15
150 likes | 292 Views
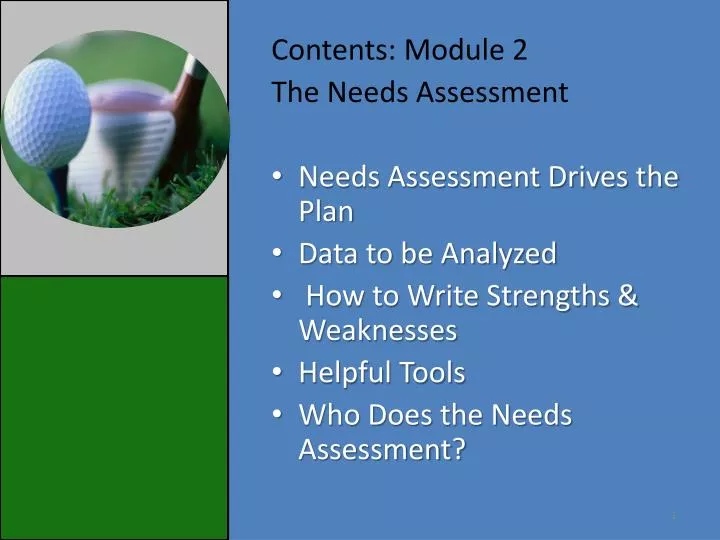
Contents: Module 2 The Needs Assessment Needs Assessment Drives the Plan Data to be Analyzed How to Write Strengths & Weaknesses Helpful Tools Who Does the Needs Assessment?. The Needs Assessment. The Driving Force of the Continuous Improvement Plan. Exploring the Plan Page.

E N D
Contents: Module 2 The Needs Assessment • Needs Assessment Drives the Plan • Data to be Analyzed • How to Write Strengths & Weaknesses • Helpful Tools • Who Does the Needs Assessment?
The Needs Assessment The Driving Force of the Continuous Improvement Plan
Exploring the Plan Page The plan has been started. Once you have completed all sections you may submit your plan for review. Assurance box will need to be rechecked with each revision.
Needs Assessment Part IB – Academic Data: • AHSGE • ARMT • Science Assessment • Stanford 10 • DIBELS Part IC – Other Data: • ADAW • ACCESS • AAA • Local Data: • School & Grade Level Assessments • Surveys (Parent, Student, Teacher) • Program specific Info (V-Math, Think Link, etc. State Initiatives and Vendor Data • RtI Information • Career Tech Information • Educate Alabama Part ID – Culture Data Demographics – student and teacher attendance, student discipline, and drop out graduation rate information Perception – parent perceptions, Pride survey information Process – curricula and personnel issues related to EL and information related to curriculum alignment, instructional strategies, reform strategies, and extended learning opportunities
73% of all 11th graders scored proficient in reading on the AHSGE
Better way: Seventy three percent of all eleventh graders scored proficient in reading on the AHSGE. This is nineteen percent below the AMO for 2010 – 2011. Areas of concern: • All students proficiency index moved in a negative direction from -7.14 in 2010 to -12.72 in 2011. • Black subgroup proficiency index moved in a negative direction from – 9.23 in 2010 to -13.38 in 2011. • Special Ed subgroup proficiency index moved in a negative direction from -29.33 in 2010 to – 53.65 in 2011. • These numbers represent a downward trend in regards to student achievement.
Using What You Learned… ARMT – • No special education population tested met AMO in reading • Special Education students in grades 3, 4, 8 did not meet AMO in Math ALABAMA SCIENCE ASSESSMENT – • 7th grade – 39% of students did not master standard 11
Using What You Have Learned… EDUCATE ALABAMA • Standard 3-b1 Instructional strategies appropriate to learning areas to improve learning skills in fluency/ vocabulary/ comprehension STUDENT ATTENDANCE • In grades 7 – 12, 102 students with 25 or more absences were involved in 3,819 absences and 1,046 Tardies
Other Sources of Data Data sources supported by SI Team
Needs Assessment Informs Part 2 Academic Goals ,Part 3 EL Goals, Part 4 Culture, and Part 7 PD Informs Part 2 Academic Goals, Part 3 EL Goals, and Part 7 PD Informs Primarily Part 4 Culture Goals and Part 7 PD Academic Data: • ________________ • AHSGE • ARMT • Science Assessment • Stanford 10 • DIBELS Other Data /Local Data/ Career Tech Plan Information ________________ • Other Data: • Educate Alabama • Technology Plan • Local Data: • Surveys (Parent, Student, Teacher) • Program specific Info (V-Math, Think Link, etc. • RtI Information • Career Tech Information • Educate Alabama Demographics – student and teacher attendance, student discipline, and drop out graduation rate information Perception – parent perceptions, Pride survey information Process – curricula and personnel issues related to ELL and information related to curriculum alignment, instructional strategies, reform strategies, and extended learning opportunities