Download
1 / 12
120 likes | 251 Views
Short-Period Gravity Wave Anisotropy Over Antarctica. Alan Wall, Kim Nielsen and Mike Taylor Center for Atmospheric and Space Science and Physics Department Utah State University Antarctic Space Sciences Workshop. CCD Multi-Emission Imaging. OI. O 2. Na. OH. Bear Lake Observatory, UT

E N D
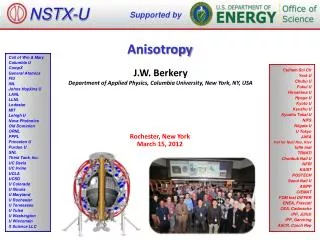
Short-Period Gravity Wave Anisotropy Over Antarctica Alan Wall, Kim Nielsen and Mike Taylor Center for Atmospheric and Space Science and Physics Department Utah State University Antarctic Space Sciences Workshop
CCD Multi-Emission Imaging OI O2 Na OH Bear Lake Observatory, UT June 4-5, 2002
Halley, Antarctica 75.5°S, 26.7°W • Collaborative NSF program with British Antarctic Survey to investigate short-period gravity wave climatology over Antarctica. • All sky Multi-wavelength CCD camera measuring mesospheric OH, Na, O2 emissions. • Observations from Halley (75.5 S) 2000-2001, and 2005. • Measurements from Rothera (67 S) 2002-2004, and 2006. Installed January 2000.
Example Short-Period Gravity Waves Imaged in the OH Emission Over Antarctica Halley Station, June 6, 2000
Short-Period Gravity Wave StatisticsHalley Station, 2000 OH (87 km) • Results: • Similar typical values to mesospheric OH waves observed at lower latitudes • Horizontal Wavelength ~15-30 km (range: 10-65 km) • Horizontal Phase Speed ~30-60 m/s (range: 5-100 m/s) • Observed Period ~8-15 min (range: 5-50 min) (Courtesy K. Nielsen, Ph.D. 2006)
Polar Plots Showing Distribution of Wave HeadingsHalley Station, 2000 and 2001 2000 2001 • Both 2000 and 2001 winter seasons show a near absence of equatorward propagating waves while poleward propagation is dominant. • The smaller number of events during 2001 was due to limited instrument operation. (Courtesy K. Nielsen, Ph.D. 2006)
Comparison of Wave Heading Anisotropy Different dominant directions from Rothera and Halley during winter months.
Azimuthal Plots Showing Variation in Wave Propagation Observed from Halley Bay, 2000 April/May Westward June Southward A clear rotation from ~west during fall to dominant poleward during the mid-winter and predominantly eastward during spring. Aug/Sept Eastward July Southward (Courtesy K. Nielsen, Ph.D. 2006)
Halley Station 5 Years Later (2005) Strong Repeatability in Wave Directionality (Sources or Filtering)
Halley Bay 2005 Distribution of Observable HoursHalley Station, 2005 Aurora and clouds limit observable hours.
Anomalous Antarctic Stratospheric Warming Event (Courtesy I. Azeem)
Investigation of Wave Activity During Stratospheric Warming PeriodRothera, 2002 • Strong westward motion. • Event occurrence frequency to be compared with months before and after Strat Warming as well other winter seasons.