Download
1 / 21
580 likes | 2.31k Views
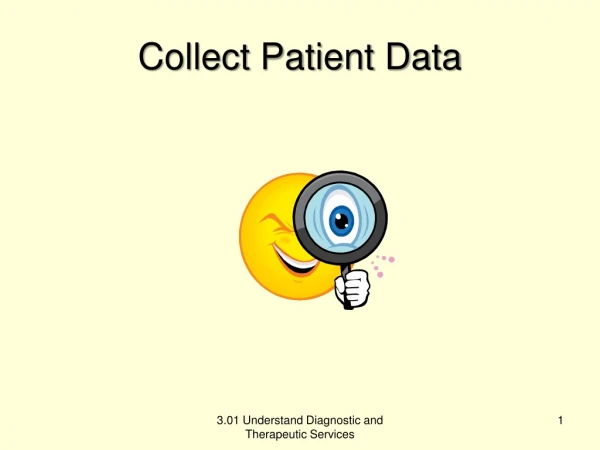
Week 3. Week 2. Week 1. Collect Data Weekly to Update Your QCPC Chart. Week. Total. OP 10. OP 20. OP 30. OP 40. OP 50. OP 60. Total. !. Week One. Week Two. Week Three. 10 %. 2 / 20. Use the Data You Collected to Calculate Your Turnback Ratio!. OP 50. Turnback Ratio. Week One.

E N D
Week 3 Week 2 Week 1 Collect Data Weekly to Update Your QCPC Chart. Week Total OP 10 OP 20 OP 30 OP 40 OP 50 OP 60 Total ! Week One Week Two Week Three
10 % 2 / 20 Use the Data You Collected to Calculate Your Turnback Ratio! OP 50 Turnback Ratio Week One Turnbacks at Operation x 100 = 10 Pieces Into Operation
Add Turnback Ratios to Determine Total Process Performance for the Week! OP 10 OP 20 OP 30 OP 40 OP 50 OP 60 Total 20% 50% 10% 40% 20% 90% 230% Week One 4/20 10/20 2/20 8/20 4/20 18/20 20% 50% 10% 40% 20% 90% + 230%
Time 10 min Before beginning, have your facilitator give you the “pieces into operation” for the week. 1. Complete a “data block” including the turnback ratio for each operation. 2. Add the turnback ratio’s for each operation to get your total turnback ratio for the week. 3. Calculate the Total Turnback Ratio for Your QCPC Chart! Week Total ??? % Data Block ?? % ?? % ?? % ?? % ?? % One ? / ?? ? / ?? ? / ?? ? / ?? ? / ??
OP 10 OP 20 OP 30 OP 40 OP 50 OP 60 Total 20% 50% 10% 40% 20% 90% 230% Week One 4/20 10/20 2/20 8/20 4/20 18/20 ! Turnbacks and Turnback Ratios Can Tell You How Well Your Process is Working! # Turnbacks: 4 10 2 8 4 18 46 # Pieces In: 20 20 20 20 20 20 20 Turnback %: 20% 50% 10% 40% 20% 90% 230% In order to produce 20 parts to requirements, You must fully or partially re-process part(s) 46 times.
Turnbacks Lead To: Wasted Time Extra Cost Inferior Quality!
How Do You Decide Which Problems to Work First? Scratch Nick Dent
2 3 4 8 Raw Data 9 5 7 6 1 Pareto-ed! 9 8 7 6 5 4 3 2 1 What We Would Like to Do is Pareto the Data! Vilfredo Pareto When you pareto your data, you organize it in such a way that you can easily identify your opportunities.
Time 15 min % Turnbacks OP 60 OP 20 OP 40 So Let’s See If We Can Pareto Your Data! 90% First, Pareto the percent turnback data by operation. 50% 40% Operation 60 Then, Pareto the total number of turnbacks by type of turnback for the operation with the greatest percent turnback. 5 Turnbacks 2 1 Electrical Mechanical Other
90% 50% % Turnbacks 40% Operation 60 OP 60 OP 20 OP 40 5 Turnbacks 2 1 Scratches Nicks Dents Use the Data to Prioritize Your Teams Activities! How do we mistake proof scratches ?
There Are All Sorts of Tools to Help You Solve Problems! • Taguchi Designed Experiments • Poka - Yoke (Mistake Proofing) • Scatter Diagrams • Fishbone Diagrams • Team Meetings • Brainstorming • Value Engineering
I Think My Program is Starting to Work. How Do I Know, and What Do I Do Next?
Let’s Try to Understand Some Key Trends to Look For! Trend One Building Trust Trend Two “Low Hanging Fruit” Once people trust and understanding what turnback data is and what it will be used for, the quantity and quality of the data will increase sharply. A sharp decline in turnbacks is normally due to identifying and solving easy problems. Other turnbacks will require more effort and take longer to see results. Trend Three Changing our Paradigms Trend Four Anyone’s Guess As the program progresses, it will become more and more difficult to effect change. You will need innovative ideas and hard work to achieve significant levels of turnback reduction. There are any number of reasons we would see this trend. Most likely, however, this occurs when we are improving our data collection or when the program has not yet received the “buy-in” of the workforce.
Aggressive Goals Spark Innovative Ideas for Solving Problems! Baseline Building Trust 50 % Turnback Reduction Turnback Ratio 90 % Turnback Reduction 3 Months 6 Months Time
Let’s Make Sure Everyone Knows How Well Your Program is Working!
Project Lists Make It Easy For Others to See How Well You Are Doing! • List projects according to their priority. • List only manageable tasks. • Keep ALL elements up to Date.
Once You Have Made Some Progress, Tell Everyone Your Successes! Project List • Must Demonstrate: • No Effect on Other Parts. • Mistake Proofing. • Design or Process Change. Success Stories
Most Importantly . . . Share Your Ideas With Others!
Now Use This as Your QCPC Map to Success! Seek Help From Others Engineering Purchasing Suppliers Integrated Product Team Tell Everyone What You Learned! Understand QCPC Form a Team Map Your Part Flow Collect Process Data Calculate Turnbacks Set Your Priorities Monitor Your Progress Work Your Problems Implement Your Solutions Check Your Solutions Post Your Successes Select a Part Act