Download
1 / 17
170 likes | 287 Views
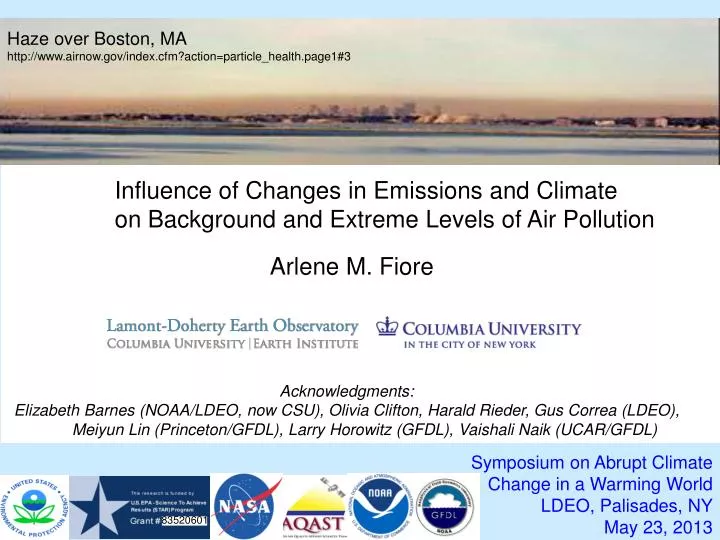
Haze over Boston, MA http :// www.airnow.gov / index.cfm?action =particle_health.page1#3. Influence of Changes in Emissions and Climate on Background and Extreme Levels of Air Pollution. Arlene M. Fiore. Acknowledgments :

E N D
Haze over Boston, MA http://www.airnow.gov/index.cfm?action=particle_health.page1#3 Influence of Changes in Emissions and Climate on Background and Extreme Levels of Air Pollution Arlene M. Fiore Acknowledgments: Elizabeth Barnes (NOAA/LDEO, now CSU), Olivia Clifton, HaraldRieder, Gus Correa (LDEO), Meiyun Lin (Princeton/GFDL), Larry Horowitz (GFDL), VaishaliNaik(UCAR/GFDL) Symposium on Abrupt Climate Change in a Warming World LDEO, Palisades, NY May 23, 2013 83520601
The U.S. ozone smog problem is spatially widespread, affecting ~108 million people [U.S. EPA, 2012] 4th highest maximum daily 8-hr average (MDA8) O3 in 2010 Future? Exceeds standard (24% of sites) http://www.epa.gov/airtrends/2011/index.html High-O3events typically occur in -- densely populated areas (local sources) -- summer (favorable meteorological conditions) Lower threshold would greatly expand non-attainment regions
Tropospheric O3 formation & “Background” contributions STRATOSPHERE lightning intercontinental transport O3 “Background” ozone NMVOCs CO METHANE (CH4) NOx + Natural sources X X Fires Human activity Land biosphere Ocean Continent Continent
Historical increase in atmospheric methane and ozone (#2 and #3 greenhouse gases after carbon dioxide [IPCC, 2007]) CH4Abundance (ppb) past 1000 years [Etheridge et al., 1998] Ozoneat European mountain sites 1870-1990 [Marenco et al., 1994] 1600 1400 1200 1000 800 1500 1000 2000 Year Preindustrial to present-day radiativeforcing [Forster et al., (IPCC) 2007]: +0.48 Wm-2 from CH4+0.35 Wm-2 fromO3
Benefits of ~25% decrease in global anthrop. CH4 emissions OZONE AIR QUALITY CLIMATE Global mean avoided warming in 2050 (°C) [WMO/UNEP, 2011] • Range over • 18 models N. America Europe East Asia South Asia • [Fiore et al., JGR, 2009; TF HTAP, 2007, 2010; Wild et al., ACP, 2012] • Possible at cost-savings / low-cost [West & Fiore 2005; West et al.,2012] • $1.4 billion (agriculture, forestry, non-mortality health) within U.S. alone [West and Fiore, 2005] • 7700-400,000 annual avoided cardiopulmonary • premature mortalities in the N. Hemisphere • uncertainty in concentration-response relationship only [Anenberget al., ES&T, 2009]
Strong correlations between surface temperature and O3 measurements on daily to inter-annual time scales in polluted regions [e.g., Bloomer et al., 2009; Camalier et al., 2007; Cardelino and Chameides, 1990; Clark and Karl, 1982; Korsog and Wolff, 1991] pollutant sources T Observations at U.S. EPA CASTNet site Penn State, PA 41N, 78W, 378m 1. Meteorology (e.g., air stagnation) July mean MDA8 O3 (ppb) Degree of mixing 10am-5pm avg 2. Feedbacks (Emis, Chem, Dep) What drives the observed O3-Temperature correlation? OH NOx VOCs PAN Deposition H2O • Implies that changes in climate will influence air quality
How will surface O3 distributions evolve with future changes in emissions and climate? Tool: GFDL CM3 chemistry-climate model Donner et al., J. Climate, 2011; Golazet al., J. Climate, 2011; John et al., ACP, 2012 Turner et al., ACP, 2012 Naik et al., submitted Horowitz et al., in prep • ~2°x2°; 48 levels • Over 6000 years of climate simulations that include chemistry (air quality) • Options for nudging to re-analysis + global high-res ~50km2[Lin et al., JGR, 2012ab] Climate / Emission Scenarios: Representative Concentration Pathways (RCPs) Percentage changes from 2005 to 2100 Enables separation of roles of changing climate from changing air pollutants RCP8.5 RCP4.5 RCP4.5_WMGG NE USA NOx Global NOx Global CO2 Global CH4 Global T (°C) (>500 hPa)
GFDL AM3 model captures key features of observed surface O3 trends (1988-2012): larger decreases in 95% vs. 50% over EUS; increases in WUS GFDL AM3 model CASTNet Observations 95% 50% Meiyun Lin, Princeton/GFDL
Regional climate change over the NE USA leads to higher summertime surface O3 (“climate penalty” [Wu et al., JGR, 2008]) RCP4.5_WMGG 2091-2100 GFDL CM3 chemistry-climate model Monthly mean surface O3 over NE USA • RCP4.5_WMGG 2006-2015 (2091-2100) – (2006-2015) RCP4.5_WMGG 3 ens. member mean: 3 ensemble members for each scenario Moderate climate change increases NE USA surface O3 1-4 ppb in JJA (agreement in sign for this region across prior modeling studies) How does NE USA O3 respond to changing regional and global emissions? O. Clifton/H. Rieder
Large NOx decreases fully offset any ‘climate penalty’ on surface O3 over NE USA under moderate warming scenario RCP4.5_WMGG 2006-2015 RCP4.5_WMGG 2091-2100 Monthly mean surface O3 (land only) over the NE USA (36-46N, 70-80W) • RCP4.5 2006-2015 • RCP4.5 2091-2100 in the GFDL CM3 model ppb 3 ensemble members for each scenario Seasonal cycle reverses; NE US looks like a remote background site! Signatures of changing emissions in observed shifts in seasonal cycles [Parrish et al., GRL, 2013]? O. Clifton
Surface O3 seasonal cycle over NE USA reverses – cold season increases- under extreme warming scenario (RCP8.5) Monthly mean surface O3 (land only) over the NE USA (36-46N, 70-80W) in the GFDL CM3 model ? ppb NOx decreases month
Why does surface O3 increase in winter/spring over NE USA under RCP8.5? Change in monthly mean surface O3 (land only) over the NE USA (36-46N, 70-80W) (2091-2100) – (2006-2015) RCP8.5 (3 ensemble members) ? NOx decreases ppb
Doubling methane raises surface O3 over NE USA ~5-10 ppb Change in monthly mean surface O3 (land only) over the NE USA (36-46N, 70-80W) (2091-2100) – (2006-2015) RCP8.5 (3 ensemble members) RCP8.5 but chemistry sees 2005 CH4 Doubling CH4 does not fully explain wintertime increase ppb
A contribution from enhanced stratosphere-to-troposphere ozone transport? Change in monthly mean surface O3 (land only) over the NE USA (36-46N, 70-80W) (2091-2100) – (2006-2015) RCP8.5 (3 ensemble members) RCP8.5 but chemistry sees 2005 CH4 RCP8.5 (3 ensemble members) RCP8.5 but chemistry sees 2005 CH4 ppb Increase (2091-2100 – 2006-2015) in stratospheric O3 tracer (qualitative indicator; caution: non-linearities!) Recovery + climate-driven increase in STE? [e.g.,Butchart et al., 2006; Hegglin&Shepherd, 2009; Kawase et al., 2011; Li et al., 2008; Shindell et al. 2006; Zeng et al., 2010] Will the NE USA resemble present-day remote, high-altitude W US sites by 2100?
Extremes: The highest summertime surface O3 events over NE USA decrease strongly under NOx controls 2005 to 2100 % change NE USA NOx Global NOx CH4 RCP8.5 RCP4.5 2006-2015 2016-2025 2026-2035 2036-2045 2046-2055 2056-2065 2066-2075 2076-2085 2086-2095 RCP8.5 vs. RCP4.5: Rising CH4 increases surface O3, at least partially offsetting gains otherwise attained via regional NOx controls H. Rieder RCP4.5 Time Time RCP8.5
Peak latitude of summertime surface O3 variability over Eastern N. America follows the jet as climate warms RCP8.5: most warming, Largest jet shift RCP4.5_WMGG Could different simulated jet positions explain cross-model disagreement in regional O3 response to climate change? Each point = 10 year mean (over all ensemble members where available) Barnes & Fiore, GRL, in press
Influence of Changes in Emissions and Climate on Baseline and Extreme Levels of Air Pollution: Summary and Next Steps • Methane controls: ‘win-win’ for climate, air quality; also economic • Climate and Clean Air Coalition (http://www.unep.org/ccac/) • Observational constraints on CH4 oxidation (and resulting O3)? • Climate change may increase O3 over NE USA but can be offset by NOx reductions which preferentially decrease the highest O3 events Other regions, seasons, with a focus on extremes Develop robust connections to changes in meteorology • NOx reductions combined with rising CH4 & strat-to-trop O3 transport fully reverse O3 seasonal cycle over NE USA • Ongoing evaluation of key processes (recent decades) • Long-term measurements crucial [e.g., Parrish et al., 2013] • Zonal O3 variability aligns with the 500 hPa jet over NE N. America • Jet shifts can influence O3:T [Barnes & Fiore, in press GRL] • Decadal shifts in jet; hold on shorter timescales? • Explore predictive power and extend beyond O3 • Relevant to model differences in O3 response to climate? • [Weaver et al., 2009; Jacob & Winner, 2009; Fiore et al., 2012]