Download
1 / 32
320 likes | 468 Views
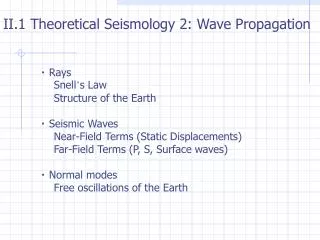
Capturing the “hum” of the Earth on low frequency seismic arrays. Barbara Romanowicz Univ of California, Berkeley in collaboration with: Junkee Rhie. 0S8. 0S4. 0S5. 3S2. 0S9. 0S10. 0S11. 0S13. 2.2. 0.6. mHz. Quiet Days Station SUR. 0S22. 0S65. Kobayashi and Nishida, 1998.

E N D
Capturing the “hum” of the Earth on low frequency seismic arrays Barbara Romanowicz Univ of California, Berkeley in collaboration with: Junkee Rhie
0S8 0S4 0S5 3S2 0S9 0S10 0S11 0S13 2.2 0.6 mHz
Quiet Days Station SUR 0S22 0S65 Kobayashi and Nishida, 1998
437 quiet days over 10 years Tanimoto, 2000
Observed Synthetic with real distrib. of M<5.8 Tanimoto, 2000
Ekström, 2000 Phase shifted 15 days with respect to winter solstice
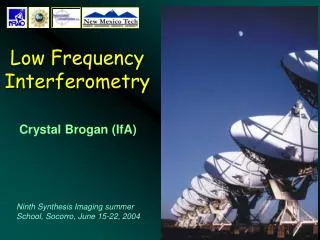
Location of “hum” using an arraymethod • Two main broadband seismic arrays equipped with STS-1 seismometers: • BDSN, California • F-NET, Japan • 3rd array: GRSN (STS-2) • Data filtered in the band 150-400 sec, or use of Gaussian filter centered at 240 sec.
Stack Amplitude as a function of time and azimuth, FNET Jan, 2, 2000 Mw 5.7 D = 74.17o Verify size of eq
Quiet Day: 2000.031 BDSN FNET
January 31, 2000 FNET+BDSN+Europe
FNET BDSN Red = winter average(oct-march) Blue = summer average (april-sept) Black = yearly average Year 2000 2 x 10⁻¹⁰ m/s 0.5 ngal
Winter 2000 Summer 2000
Seismic background noise Significant wave height (Topex-Poseidon) Rhie and Romanowicz, 2004
Excitation mechanism • Involves coupling between atmosphere/ocean and solid earth • energy dissipation in the oceans • Further understanding: • need for STS-1 or equivalent large aperture arrays, especially in the southern hemisphere (e.g. Australia) • arrays in the ocean spanning the entire water column
BDSN FNET Red: winter Blue: summer black: array response Spectra
Year 2000 Correl. Coef. =0.78 Summer Winter Winter Red = BDSN; back-azimuths = 295o (winter); 105o (summer) Blue = FNET; back-azimuths = 65o (winter); 235o (summer)
“Quiet day”: 01/31/2000
BDSN BDSN Jan 31, 2000 FNET
Jan 2, 2000 Mw 5.8 D = 36.31o
Excitation mechanism • Must involve coupling between atmosphere, ocean and solid earth: • Wind generated waves (~10-20sec) • Conversion to long period infragravity waves (100-300 sec) by non-linear interactions near the shore • bounded and free infragravity waves • Coupling of infragravity waves to solid earth in the deep ocean • depends on ocean basin width, depth and shape of coasts
Very few “point source” like events found: • “Slow earthquakes” (e.g. Beroza and Jordan, 1990) detectable in the period band 150-400 sec are very rare, in contrast to the shorter period band 30-150 sec (e.g. Ekström et al., 2003). • Further analysis: • Distributed sources • random around the globe?