Download
1 / 64
650 likes | 887 Views
Topic 2 – Urban Transportation and Energy. A – Transportation and Energy Consumption B – Energy, Transportation and Urban Form C – Alternative Sources of Energy for Urban Transportation. Transportation and Energy Consumption. A. 1. Energy in a Mobile World 2. Utility Factors

E N D
Topic 2 – Urban Transportation and Energy A – Transportation and Energy Consumption B – Energy, Transportation and Urban Form C – Alternative Sources of Energy for Urban Transportation
Transportation and Energy Consumption A • 1. Energy in a Mobile World • 2. Utility Factors • 3. Petroleum Dependency • 4. Combustion of Hydrocarbons • 5. Energy Consumption
Energy in a Mobile World A-1 • Nature • Energy is movement or the possibility of creating movement. • Exists as potential (stored) and kinetic (used) forms. • Conversion of potential to kinetic. • Movement can be ordered (mechanical energy) or disordered (thermal energy). • Major tendency is to move from order to disorder. • Importance • Human activities are closely dependant to the usage of several forms and sources of energy. • Development processes have increased demand and reliance on energy. • Human activities are strongly supported by the usage of energy. • Overcoming territories in a global economy requires a substantial amount of work. • Work related to transfers of goods, people and information has increased significantly. • Growing share of transportation in the total energy spent.
Sources of Energy A-1 Non-Renewable • Chemical • Fossil fuels (Combustion) • Nuclear • Uranium (Fission of atoms) Renewable • Chemical • Muscular (Oxidization) • Nuclear • Geothermal (Conversion) • Fusion (Fusion of hydrogen) • Gravity • Tidal, hydraulic (Kinetic) • Indirect Solar • Biomass (Photosynthesis) • Wind (Pressure differences) • Direct Solar • Photovoltaic cell (Conversion) Energy
World Fossil Fuel Consumption, 1950-1998 (in million of tons of equivalent oil) A-1
Energy in a Mobile World A-1 • Energy exists in various forms • Mechanical, thermal, chemical, electrical, radiant, and atomic and are all interconvertible. • Forms of energy come from sources qualified as renewable and non-renewable. • Renewability • Based upon the scale of human events and if the source can be replaced during that period. • Wood is a renewable biomass energy source as long as adequate conditions are kept for reserves to be replenished. • Rates of exploitation / deforestation in a number of areas are so high that biomass may be considered as a non-renewable source in those circumstances.
Energy in a Mobile World A-1 • Choice of an energy source • Depend on a number of utility factors. • Factors that favors a specific source. • Currently favoring the usage of fossil fuels, notably petroleum. • Energy and work • Many efforts have been done to alleviate work. • Creating more work performed by extra-human agents like motors and the usage of even more energy. • Modification of the environment • Rendering space suitable for human activities. • Clearing land for agriculture. • Modifying the hydrography (irrigation). • Establishing distribution infrastructure. • Constructing and conditioning (temperature and light) enclosed structures.
Energy in a Mobile World A-1 • Appropriation and processing resources • Extraction of agricultural products from the biomass and raw materials (minerals, oil, lumber, etc.) for human needs. • Disposal of wastes, which are in an advanced industrial society very work intensive to safely dispose. • Modifies products from the biomass, raw materials and goods to manufacture according to economic needs. • Over the last 200 years, work related to processing was considerably mechanized (e.g. robotized assembly lines).
Energy in a Mobile World A-1 • Transfer • Movements of freight, people and information from one place to another. • Attenuate the spatial inequities in the location of resources by overcoming distance. • The less energy costs per ton or passenger - kilometer, the less importance has transfers. • Overcoming territories in a global economy requires a substantial amount of work. • Work related to transfers of goods, people and information has increased significantly. • Growing share of transportation in the total energy spent. • The United States is an economy using massive amounts of energy in the transport sector.
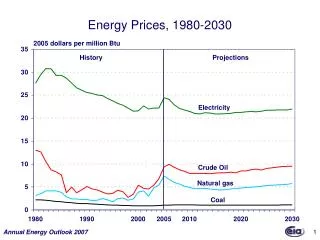
Energy in a Mobile World A-1 • United States • Huge consumer of energy. • Pattern of consumption is strongly linked to the attributes of the American economy and territory. • Accounts for 5% of the global population, but for 25% of the produced energy. • Transportation accounts for about 24% of all the energy used in the United States.
Demand for Refined Petroleum Products by Sector in the United States, 1970-1998 (in Quadrillion BTUs) A-1
Energy in a Mobile World A-1 • 15th Century • Traditional societies. • Rely only on muscular and biomass sources to answer their energy needs. • Mainly the characteristics of the Middle Ages and other previous historical periods. • Mid 19th Century • Beginning of the Industrial revolution. • Considerably modified energy sources. • Greater reliance on coal. • Early 20th Century • Middle of the industrial revolution. • Coal is dominant source of energy. • Gradual shift towards higher energy content sources like oil.
Energy in a Mobile World A-1 • End of 20th Century • Modern energy intensive society. • Contemporary technological developments allowed: • Higher occurrence, a better transferability, reliability, storability, flexibility, safety and cleanliness of high energy content sources for a low price. • Emphasis on petroleum products as the main provider of energy. • Reached the point where the world economy highly depends on the internal combustion engine and supporting industries.
Global Energy Systems Transition, (% of market) A-1 100 Wood Solids Coal 80 Gases 60 Hydrogen 40 Liquids Oil 20 Natural Gas 0 2000 2050 2100 2150 1850 1900 1950
Utility Factors A-2 • Nature • Favor the usage of petroleum as the main source of energy for transport activities. • The utility factors were so convenient that a dependency on petroleum was created. • Occurrence • Location of energy sources considering the demand. • Several energy sources are only available when a transportation system exists • Can support transfers between the supply and the demand. • Exploitation of oil fields in several regions of the World (Middle East, Siberia, etc.). • Only possible when an efficient transportation system based upon pipelines and tankers was established.
Utility Factors A-2 • Transferability • Distance over which an energy source can be transported. • Depends on its physical form (solid, liquid or gas), its energy content, and on the available transport technology. • Most petroleum products are in a liquid, more or less viscous, form. • Offer an efficient form to be transferred. • Economies of scale in transportation enhance transferability.
Economies of Scale in Oil Transportation Modern VLCC (305 m) 1975 T2 Tanker (153 m) 1942 A-2
Utility Factors A-2 • Energy content • Available energy per weight or volume unit of a source. • A low energy content is inadequate when demand is high and concentrated in space. • Gasoline and other petroleum products have a high energy content compared to other fossil fuels like coal. • Even more when compared to gravity and solar energy. • Reliability • Continuous availability is an advantage over intermittent sources. • Many sources and continuous supply through maritime and land routes have given a relative reliability for petroleum products.
Utility Factors A-2 • Some contemporary military interventions were performed to insure the reliability of oil sources and their transport. • Storability • An energy source has an advantage when it can be stored to answer variations in demands and interruptions of supplies. • In liquid form, petroleum products are easily stored. • Flexibility • Capacity of an energy source to answer multiple usage. • Petroleum by-products are the basis of whole industrial sectors (petrochemical). • Synthesize goods like plastics, pharmaceutical products, and synthetic rubber.
Utility Factors A-2 • Safety • Sources that can be provided and used at low risks (human and environmental) are an advantage. • The petrochemical industry presents some risks (accidents during extraction, refining, transport and usage). • Oil is considered a safe source of energy for its production and usage. • Cleanliness • Sources that produce few waste and are cleanly used have an advantage. • In regards of other conventional energy sources like coal and wood and of the available technology, oil is cleaner to use and produces a limited amount of waste.
Utility Factors A-2 • Price • Sources at low cost are generally more used. • A function of the occurrence, the transferability and the energy content of the source. • Massive investments on large scale extraction, refining and transport of petroleum products. • Constant supply. • Intensive competition from several oil producing countries (although with some monopolistic control - OPEC). • Oil price is cheaper than many other sources.
Petroleum Dependency A-3 • The reliance on petroleum • Petroleum products account for more than 97% of the energy consumption by transportation modes. • Transportation accounts for a growing share of the oil used. • The share of transportation has increased in the and now accounts for more the 55% of the oil used. • Since 1973 the price of petroleum has increased significantly. • The transport sector consumed 42% of the oil in OECD countries in 1973. • This share climbed to 55.1% in 1995. • The sprawl of economic activities, notably in urban areas, is strongly linked to this trend.
Oil Energy Consumption by Sector for OECD countries, 1973-1995 A-3
Petroleum Dependency A-3 • Impacts of increasing prices • Increasing the fuel efficiency of vehicles. • Use of alternative sources of energy.
World Oil Production and Estimated Resources, 1900-2100 (in billions of barrels) A-3
Gasoline Prices, 1978-1999 Selected Countries (current 1998 dollars per gallon) A-3
Combustion of Hydrocarbons A-4 • Internal combustion engine • Almost all transportation modes depend on the internal combustion engine. • For the majority of internal combustion engines, gasoline (C8H18; four strokes Otto-cycle engines) serves as fuel. • Other sources like methane (CH4; gas turbines), diesel (mostly trucks) and kerosene (turbofans) are used. • Perfect combustion • If all internal combustion engines had perfect combustion, emissions and thus environmental impacts of transportation would be negligible (except for carbon dioxide emissions). • Combustion in internal combustion engines is imperfect and incomplete.
Combustion of Hydrocarbons A-4 • Chemical reaction • Complete and perfect combustion of gasoline: • (2) C8H18 + (25) O2 = (16) CO2 + (18) H2O + energy • Gasoline produces around 46,000 Btu per kilogram combusted. • Requires from 16 to 24 kg of air. Gasoline Oxygen Combustion Carbon Dioxide Water Energy
Combustion of Hydrocarbons A-4 • Control or the process • Energy released by combustion causes a rise in temperature of the products of combustion. • Temperature attained depends on the rate of release and dissipation of the energy and the quantity of combustion products. • Air is the most available source of oxygen. • Air also contains vast quantities of nitrogen. • Nitrogen becomes the major constituent of the products of combustion. • Rate of combustion may be increased by finely dividing the fuel to increase its surface area and hence its rate of reaction. • Mixing it with the air to provide the necessary amount of oxygen to the fuel.
Combustion of Hydrocarbons A-4 Imperfect combustion • The fuel and the oxider are not pure. • Gasoline is known to have impurities • Sulfur (0.1 to 5%). • Sometimes lead (anti-knock agent). • Other hydrocarbons (like benzene and butadiene). • Air is composed of 78% nitrogen and 21% oxygen. Gasoline Sulfur Benzene Nitrogen Oxygen Air Combustion Carbon Dioxide Carbon monoxide Nitrogen Oxides Water Energy VOC + HC
Combustion of Hydrocarbons A-4 • Consequences of incomplete combustion • Incomplete combustion emits other residuals. • Because of the technology of the engine. • Besides carbon dioxide and water, a typical internal combustion engine will produce: • Carbon monoxide (CO). • Hydrocarbons (HC; benzene, formaldehyde, butadiene and acetaldehyde). • Volatile organic compounds (VOC). • Sulfur dioxide (SO2), particulates, and nitrogen oxides (NOx). • These combustion products are the main pollutants emitted in the environment by transportation.
Transportation and Energy Consumption A-5 • Issue • Differences between speed, energy costs, mode and type of loads (freight and passengers). • Economies of scale play a crucial role in freight transportation • Transposed in its general levels of energy consumption. • Transportation operators always ponder a compromise between speed (returns in overcoming distance) and energy (costs in overcoming distance). • Lowest consumption levels are associated with bulk freight travelling at slow speed (like oil). • Compromise of energy over speed. • High levels correspond to passengers or merchandises being carried at high velocities. • Compromise of speed over energy.
Transportation and Energy Consumption A-5 10 Helicopter Worst performance Car Supersonic plane Jet plane Propeller plane Bus 1 Train Cargo plane Gas pipeline Truck Energy costs Bicycle .1 Container ship Freight Oil Pipeline Passengers Train .01 Tanker Best performance Speed (m/sec) .002 300 10 30 100 1000
Transportation and Energy Consumption A-5 • Car • Poor energetic performance. • Road transportation consumes 85% of the total energy used by the transport sector in developed countries. • Only 12% of the fuel used by a car actually performs work. • Exhaust (33%). • Cylinder cooling (29%). • Engine friction (13%). • Transmission and axles (5.5%). • Braking (7.5%).
Factors of Fuel Use by Transportation A-5 Technology Vehicle efficiency Type of fuel Economics Prices and incomes Fuel Use Infrastructure Provision and Levels of service Urban Form Density and distribution
Average Gasoline Consumption for New Vehicles, United States, 1972-2001 (in miles per gallon) A-5
Light-Duty Vehicles Sales in the United States, 1975-2001 (in 1,000s) A-5
Change in Average Vehicle Characteristics, 1981-2001 (in %) A-5
Average Miles per Gallon Traveled by Road Vehicle in the United States, 1996 A-5
Energy Consumption by Mode of Transportation in the United States (in Trillion BTU) A-5
Energy Consumption by Road Transportation in the United States (in Trillion BTU) A-5
Energy, Transportation and Urban Form B • 1. The Notion of Distance • 2. Factors Affecting Distance Traveled
Factors Affecting Distance Traveled A-1 • Trends • The distance traveled has increased over the last 20 years in developed countries. • Predominantly in urban areas. • VMT (VKT) • Vehicle-Miles Traveled (or Vehicle-KM). • Important measure of the usage of energy by transportation. • Has increased 3% per year on average since 1970. • Growth systematically higher than population growth and GDP growth. • VMT growth has been linked to a set of factors.
Factors Affecting VMT Growth A-1 Vehicle Ownership Vehicle Occupancy Population Age VMT Economic Activity Trip Length Spatial Structure Cost of Driving Alternatives available