Download

1 / 18
180 likes | 197 Views
Discrete & Continuous Domains. Functions shows a recipes mix of adult & children show tickets. Domain (x-values): 0, 1, 2, 3, 4 Range (y-values): 8, 6, 4, 2, 0.

E N D
Functions shows a recipes mix of adult & children show tickets. Domain (x-values): 0, 1, 2, 3, 4 Range (y-values): 8, 6, 4, 2, 0 • The domain is discrete because it has only the numbers 0, 1, 2, 3, and 4. Discrete graphs are made up of distinct, or unconnected, points. • Since there is no such thing as half a ticket, or one-forth of a ticket the domain does not include those points between the points graphed. Adults $4.00 Children $2.00
Functions shows a recipes mix of cheddar & Swiss cheese. Domain (x-values): x ≥ 0 and x ≤ 0 (all numbers from 0 to 4) Range (y-values): y ≥ 0 and y ≤ 8 (all numbers from 0 to 8) • The domain is continuous because it includes all numbers from 0 to 4 on the number line. Continuous graphs are made up connected lines or curves. • Cheese can be divided into fractions or decimals, so it is shown to be continuous by using a line to include all of those points. Cheddar: $2/lb Swiss: $4/lb
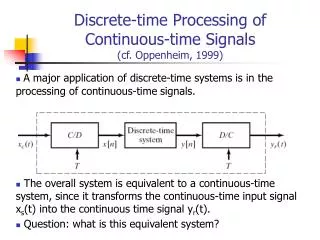
Write a linear function to represent each problem. • Graph the function. • Describe the domain and range of each function. Is the domain discrete or continuous? You are in charge of reserving hotel rooms for a baseball team. Each room costs $69, plus $6 tax, per night. You need each room for two night. You need 10 to 16 rooms. Write a function for the total hotel costs.
Write a linear function to represent each problem. • Graph the function. • Describe the domain and range of each function. Is the domain discrete or continuous? The airline you are using for the baseball trip needs an estimate of the total weight of the team’s luggage. You determine that there will be 36 pieces of luggage and each piece will weigh from 25 to 45 pounds. Write a function for the total weight of the luggage.
-3 -2 -1 0 1 2 3 4 5 -3 -2 -1 0 1 2 3 4 5 Key Idea • A discrete domain is a set of input values that consists of only certain numbers in an interval. Like integers 1 to 4. • A continuous domain is a set of input values that consists of all numbers in an interval. Like all numbers 1 to 4. BACK
Matching Situations to Graphs The graphs show the speeds of two cars over time. Tell which graph corresponds to each situation. Mr. Lee is traveling on the highway. He pulls over, stops, then accelerates rapidly as he gets back on the highway. Graph 2
Matching Situations to Graphs The graphs show the speeds of two cars over time. Tell which graph corresponds to each situation. Ms. Montoni slows down as she leaves the main road. She continues to slow down as she turns onto other streets and eventually stops in front of her house. Graph 1
Runner’s Speed Runner’s Speed Runner’s Speed Time Time Time Check It Out: Example 1A Tell which graph corresponds to the situation described below. Graph 2 Graph 1 Graph 3 Jamie begins the race, and soon feels a pain in a muscle. He is unable to complete the race. Graph 2—Jamie is unable to complete the race, so his speed decreases to zero.
Runner’s Speed Runner’s Speed Runner’s Speed Time Time Time Check It Out: Example 1B Tell which graph corresponds to the situation described below. Graph 2 Graph 1 Graph 3 Melissa builds up her speed during the beginning of the race. She maintains her running speed for the remainder of the race. Graph 1—Melissa’s speed increases at the beginning and then the graph remains constant.
Time 8:00 8:30 12:00 12:30 Temp.(F) 71 71 82 74 Temp (F) Time Creating a Graph of a Situation Create a graph for the situation. Tell whether the graph is continuous or discrete. The table shows the temperature inside a car over time. Car Temperature Since every value of time has a corresponding altitude, connect the points. The graph is continuous.
Cost($) Pumpkins Purchased Creating a Graph of a Situation Create a graph for the situation. Tell whether the graph is continuous or discrete. A market sells pumpkins for $5 each. Pumpkin Cost The cost (y-axis) increases by $5 for each pumpkin purchased (x-axis). Because each person can only buy whole pumpkins or none at all, the graph is distinct points. The graph is discrete.
Time 8:00 10:00 12:00 2:00 Distance (mi) 280 320 500 580 Distance (mi) Time Example 2A Create a graph for the situation. Tell whether the graph is continuous or discrete. The table shows the distance traveled during a family vacation. Distance Travelled Since every value of time has a corresponding altitude, connect the points. The graph is continuous.
Lesson Quiz Tell which graph corresponds to the situation. Then tell whether the graph is continuous or discrete. A bus pulls out from the gas station. It drives to its first stop. Then the bus gets on the expressway. Graph B; continuous
Lesson Quiz for Student Response Systems • 1. Maggi has $25 in her bank account. She gets $5 every day from her father and deposits the money in the account for the first three days. On the fourth day, she buys a hat for herself with the money. Identify the table that corresponds to this situation. • B.
Discrete & Continuous Domains Holt Course 3 3.3 Glencoe 2-3C