Download

1 / 36
360 likes | 457 Views
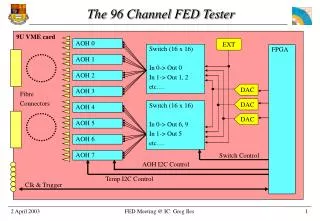
Current FED Tester Status. Toolbox. Calibrator. TrimDAC Calibration. FTE AOH Calibration. FED Timing Calibration. Configurator. Initialise Device Descriptions. Allow User To Make Changes. Provide Access To Descriptions. Initialiser. Initialise Devices. Provide Access To Devices.

E N D
Current FED Tester Status James Leaver
Toolbox Calibrator TrimDAC Calibration FTE AOH Calibration FED Timing Calibration Configurator Initialise Device Descriptions Allow User To Make Changes Provide Access To Descriptions Initialiser Initialise Devices Provide Access To Devices Software Status • FED Tester software is in a fairly refined state • Universal Toolbox class enables full calibration, configuration and initialisation of system with a single function call • Toolbox configures and provides access to: • FED Testers • FED • FED Kit • Frame data generator • FED event wrapper which transparently enables readout though Slink or VME • Forms the core of several testing programs, which could easily be used at RAL • Entire FED Tester Software package: 31,563 physical lines of code so far… James Leaver
TrimDAC & AOH Calibration • TrimDAC calibration: • FED Tester output disabled • FED TrimDACs calibrated (Fed9UDevice method) • TrimDAC values increased to shift baseline below FED ADC range – ensures efficient use of ADC range when optical input from FED Testers is present • AOH calibration: • FED Testers output alternate digital high / digital low signals to each FED channel • FED Tester AOH bias currents and gains are adjusted for each FED channel to optimise use of FED input ADC range James Leaver
TrimDAC & AOH Calibration: Results FED ADC range (digital low → digital high) post TrimDAC and AOH calibration: James Leaver
FED Timing Calibration • FED Testers send tick marks to FED • All FED coarse and fine delay settings are scanned through • Appropriate FED delay settings for each FED channel are found, to ensure optimal data sampling points James Leaver
FED Timing Calibration: Results Positions of calibrated sampling points on a tick mark for FE Unit 0: James Leaver
FED Inter-Channel Crosstalk • Wanted to measure the effects of crosstalk between FED channels • Will show two sets of results here: • ‘Worst Case’: • 11 of 12 FE Unit channels carry a ‘noise’ signal, look at crosstalk on remaining channels • ‘Nearest (& Next Nearest) Neighbour’: • 1 of 12 FE Unit channels carry a ‘noise’ signal, look at crosstalk on neighbouring channels James Leaver
Crosstalk: Worst Case: Setup • Sent typical frame to FE Unit channel 5 • Sent similar frame to other FE Unit channels, but added a delay of 10 clock cycles • (Repeated for each FE Unit) • Used FED Testers to simultaneously phase shift all frames relative to FED sampling point, from 0 to ~25 ns in ~100 ps steps • By capturing Scope Mode data from the FED at each phase step, can build up a high resolution image of signal seen by FED James Leaver
Crosstalk: Worst Case: Results FE Unit 0: A view of the overlapping frame digital headers - All channels apart from 5 see the blue input signal James Leaver
Crosstalk: Worst Case: Results(2) Level shift of ~4 ADC counts when blue frame goes low (power issue?) Spikes of ~10 ADC counts in amplitude James Leaver
Crosstalk: Nearest Neighbour: Setup • Send typical empty frame to all FE Unit channels apart from 5 • Send a frame to FE Unit channel 5 which has a 2-strip wide ‘pulse’ in the centre of the payload • (Repeated for each FE Unit) • Use FED Testers to phase shift frames sent to channel 5 (keep constant phase for other channels) – build up high resolution signal images as before • Repeat with 3 pulse heights: • Pulse 1: Pedestal to digital high • Pulse 2: Pedestal to (2/3) * (digital high) • Pulse 3: Pedestal to (1/3) * (digital high) James Leaver
Crosstalk: Nearest Neighbour: Results • FE Unit 2: All channels apart from 5 see the blue input signal • With maximum ‘noise’ pulse height: • Nearest neighbour crosstalk amplitude: ~3.5 ADC counts • Next nearest neighbour crosstalk amplitude: negligible Pulse 1: Nearest Neighbour Pulse 1: Next Nearest Neighbour James Leaver
Crosstalk: Nearest Neighbour: Results(2) Pulse 3: Nearest Neighbour Pulse 2: Nearest Neighbour James Leaver
FED Channel Noise • Simple noise measurement: • Disabled FED Tester output and set appropriate FED TrimDAC / OptoRx values (constant across all channels) • Captured a Scope Mode event for each FED channel (Scope Length = 1020) • Found mean and standard deviation of signal at each channel: James Leaver
FED Hit Check • Wanted to check that the numbers / locations of hits input to the FED match the numbers / locations of hits output by the FED in Zero Suppressed Mode. James Leaver
FED Hit Check: Setup • Ran with 100 kHz random triggers, FED in Zero Suppressed Mode • Used randomly generated events with simulated CMS cluster distribution (2% Tracker occupancy) • Set FED strip high & low thresholds to 50 • Set the hit height in our randomly generated frames to vary (almost) between pedestal and digital high • i.e. from just below the FED strip threshold to near the top of the FED ADC range • Generated 1024 events (FED Tester capacity), read them out through the FED, generated another 1024 events, repeated 100 times • Compared every input hit ADC value with every output hit ADC value; expect a linear scatter graph of non-zero values if FED detects every input hit correctly James Leaver
FED Hit Check: Results FED Channel 0: Graph contains data from ~5 x 10⁵ hits James Leaver
FED Hit Check: Results(2) Close-up of linear region James Leaver
FED Hit Check: Results(3) Extreme close-up of linear region James Leaver
FED Hit Check: Results(4) A close-up of the region around the FED strip threshold: The FED appears to detect a small fraction of hits that occur below the strip threshold! James Leaver
FED Hit Check: Results(5) A scatter plot of the same data shows the effect more clearly: ‘Hits’ below FED threshold ‘Hits’ detected when input signal is zero James Leaver
FED Hit Check: Unexpected Non-Zero ADC Values Why does the FED return non-zero ADC values for strips that do not contain valid hits? • → Due to data packaging format: i.e. 1 Value Below Threshold 1 Cluster Cluster 1 Cluster 2 Event Data OR Noise FED Strip Threshold 1 cluster with 1 strip below threshold: • Transmitted as 1 cluster • Read out below-threshold hit level, instead of zero • Non-zero ADC value = ‘invalid hit’ 2 clusters separated by 1 strip: • Transmitted as 1 cluster • Read out noise level at the strip in-between, instead of zero • Non-zero ADC value = ‘false hit’ James Leaver
FED Hit Check: Unexpected Non-Zero ADC Values(2) • The non-zero ADC values transmitted due to data formatting might be intentional… • Or perhaps the Fed9UEvent class could filter them out with a threshold cut… • To work around the issue, the FED Hit Check was repeated using randomly generated frames containing only single strip clusters, separated by more than 1 strip • Reduced Tracker occupancy to 1% to account for increased data volume James Leaver
FED Hit Check: Single Hit Results All invalid ‘hits’ have vanished Result: FED is correctly identifying all input hits James Leaver
FED Hit Check: Single Hit Results(2) Results from all 96 FED channels: James Leaver
FED Efficiency Test • Wanted to test that FED operates correctly with: • 100 kHz random triggers • High Tracker occupancy • Slink readout • FED throttling system in place • Also wanted to test FED efficiency (fraction of events lost vs. Tracker occupancy) predictions made by Emlyn • However, the assumptions used in earlier predictions have changed: • Emlyn used 2 bytes per hit (strip position, ADC value) • Now have cluster finding (cluster position, cluster width, ADC values) • Emlyn used back-to-back frames • Could reproduce Emlyn’s conditions, with fixed 2 strip wide clusters and back-to-back frames… • … But our goal is to replicate CMS, so more realistic conditions were used (FED efficiency prediction should still be reasonably accurate) James Leaver
FED Efficiency: Buffering in ZS Mode Emlyn’s predictions: • Large buffers: 80 MB/s FE-BE link dominates • Occupancy reaches ~9% before events are lost Front-End @ 140 kHz (b2b frames) Back-End @ 140 kHz (b2b frames) • Large buffers: slink dominates • Events lost when: • Occupancy ~1.4% at 100 MB/s • Occupancy ~2.8% at 200 MB/s → Slink data rate determines FED efficiency James Leaver
FED Efficiency: Experimental Setup • Random 100 kHz triggers • FED in Zero Suppressed mode • Readout rate through Slink limited to maximum of 200 MB/s • Sent randomly generated frames with simulated CMS cluster distribution • Increased simulated Tracker occupancy of generated frames and recorded fraction of events vetoed by FED James Leaver
FED Efficiency: Cluster Distribution Simulated cluster distribution was generated from the plots in Figure 4 of Ian Tomalin’s CMS-IN 2005/025 Note: Mean = 2.96 strips per cluster Average size of hit = 1.91 bytes (Emlyn’s average hit size = 2 bytes) Note: Would clusters of this size really exist? James Leaver
FED Efficiency: Results Events lost when occupancy exceeds ~2.8% with 200 MB/s readout rate James Leaver
FED Efficiency: CRC Errors FED Efficiency Test yields unexplained distribution of CRC errors at high Tracker occupancies… James Leaver
FED Efficiency: Theoretical Vs Measured Data Rates • Theoretical data rate from CMS Note 2002/047: • TIB1 ‘Full’ FED (180 of 192 APVs) • Zero Suppressed, 100 kHz triggers, Occupancy of 2.8 - 2.9% → Data rate = 109.5 MB/s • Measured data rate at occupancy of 2.9% = 217.8 MB/s • Reason for discrepancy? • Current ‘formatting’ information (non-data) = 816 bytes / event • CMS Note ‘formatting’ information (non-data) = 112 bytes / event • Assume current average data padding = 32 bytes / event • Scale by FED fill factor of 180 / 192 • ‘Corrected’ measured data rate = 139 MB/s James Leaver
FED Efficiency: Theoretical Vs Measured Data Rates(2) • ‘Corrected’ measured data rate = 139 MB/s • Can use average cluster width of generated frames to estimate expected data rate: → 132 MB/s (good agreement) • Calculate average of 1.55 bytes / hit for Ian’s data: • Implies large number of clusters with 4 or more hits • TIB1 cluster distribution in CMS Note must be different to that used in measurement - should account for remaining discrepancy… • Conclusion: • A true data rate comparison would require more accurate cluster distribution data for the frame generator • Results show some agreement with Emlyn’s prediction, but cannot demonstrate FEDs performance in final system until we have accurate cluster distribution information and the FED Zero Suppressed ‘Lite’ mode • i.e. Current data rates are significantly higher than those expected at CMS James Leaver
Summary • FED Crosstalk: • Unpleasant effects when a single frame arrives at the FED out of sync with the others… • …But crosstalk caused by ‘hit’ features is small and should only impact nearest neighbours • FED Channel Noise: • Average noise is less than 1 ADC count, with no significant variation from channel to channel • FED Hit Check: • FED correctly identifies hits in Zero Suppressed mode (for a 2% Tracker occupancy) • FED Efficiency: • FED vetoes triggers at high data rates in a similar manner to that predicted by Emlyn, but Zero Suppressed ‘Lite’ mode required for genuine CMS performance characterisation • Measured data rates show reasonable agreement with theory, but a more accurate cluster distribution is required James Leaver
Unresolved FED Problems… • FED still randomly produces a small fraction of events with CRC errors (~1 in 1-10 million events, depending upon Tracker occupancy) • Possibly a timing issue due to transition to new FPGA tools…? James Leaver
What Do We Test Now? • Still need to investigate: • Pedestal variations • Pipeline addresses • Use of TTC • etc. • Need to prioritise remaining tests, and check that all important areas are included… James Leaver