Download
1 / 66
670 likes | 946 Views
WATER FOR A GROWING CITY: A CASE OF LUSAKA THE CAPITAL OF ZAMBIA. UNZA IWRM CENTRE. Prof. Imasiku A. Nyambe, Coordinator IWRM Centre. FORMAT OF PRESENTATION. 1. Introduction: SADC level. Challenges of Lusaka: Peri-Urban (PU) areas in Zambia. 3. Response Options. 4. Conclusion.

E N D
WATER FOR A GROWING CITY: A CASE OF LUSAKA THE CAPITAL OF ZAMBIA UNZA IWRM CENTRE Prof. Imasiku A. Nyambe, Coordinator IWRM Centre
FORMAT OF PRESENTATION 1. Introduction: SADC level • Challenges of Lusaka: Peri-Urban (PU) areas in Zambia 3. Response Options 4. Conclusion
WATER FOR A GROWING CITY A CASE OF LUSAKA THE CAPITAL OF ZAMBIA 1. Introduction
Major River Basins of Southern Africa - 14 SADC DRIVERS OF CHANGE ECONOMY: Agriculture is the most important economic activity and the biggest water consumer (~80%) In terms of INFRASTRUCTURE: Note # DAMS Source: Satellite Image: USGS MODIS, 28 December, 2001 Rivers and Dams: FAO Atlas of Water Resources and Irrigation in Africa – Aquasat, FAO 2001 Ramsar Sites: Ramsar 2003: www.ramsar.org
The member states vary significantly in terms of size and composition of their economies, and population size (Table 1 – 1995 SADC Website data). Table 1: Basic SADC Demographic and Economic Information 40%
Climate-wise, the SADC region is very large and has a very varied range of climatic conditions from tropical with an annual rainfall in excess of 2000 mm to desert conditions with no appreciable rainfall (Table 2). Table 2: Climatic variety in the SADC region
In terms of water availability, SADC Water is usually found in one of three forms: • There is either too much, • Or there is too little, • Or it is too dirty” We could also add that water is often: • Out of sight (underground), or • Someone else’s property
Variable, Extreme Events, Risks Frequent droughts, often “broken” by devastating floods Effluent contamination and water-borne diseases Kanyama Floods, 1978
Rapid population growth (Urbanisation) is a major concern and will continue to affect the economic development of SADC member states (Fig. 1).
Fig. 1: Population Growth and Water Availability in the SADC Source: SADC, IUCN, SARDC, World Bank, Sida. Defining and Mainstreaming Sustainability in Water Resources Management in Southern Africa, 2002. p.38
Water security Adequate water Water stress Chronic scarcity N N 0 500 1000 0 500 1000 Kilometres Kilometres Water Available per Person in 2002 and 2025 2002 2025
76 – 100 % 51 – 75 % 26 – 50 % N N 0 – 25 % 0 500 1000 0 500 1000 Kilometres Kilometres Access to an Improved Water Source – 2003 Urban Rural
0 - 5 % 6 - 10 % 10 - 15 % 15 - 20 % 20 - 30 % N 500 0 1000 > 30 % Kilometres Adult (Age 15-49) HIV/AIDS Prevalence Dec. 2003 Cross-Cutting Issues Data Sources: • UNAIDS, 2004 • World Factbook, 2004 (Updated 2 Nov. 2004) • World Population Data Sheet, 2004
This is a case of WATER FOR A GROWING CITY : an example of LUSAKA THE CAPITAL OF ZAMBIA Where 3 constituencies are predominantly made of unplanned settlements of the city. Similar examples 3 SADC cities of Dar-Es-Salaam, Harare, & Maputo.
Zambia is a land-locked country in Southern Africa with an area of 752,620 square kilometers. Administratively it is divided into nine provinces with 72 districts (Government of Zambia; 2002) with a total population of 9.8 million in 2000; 11.7million in 2006.
Rivers and Lakes Zambia has six main catchment areas Four major rivers Four natural lakes Extensive swamps Flood plains Shared watercourse systems e.g. ZRB
Surface Water Quantity Zambia has generally sufficient surface water to meet the present and future demands. The total surface water potential is estimated to be 237 million m3/day, distributed among major rivers as shown. (JICA, 1995) However surface water is not available all over the country, especially the southern and western provinces depends largely on groundwater.
The total average GW recharge estimated at 57.5 X 10 9 m3/year equivalent to 78 mm/year (JICA, 1995). Daily abstraction of 157 million m3/day. Representing about 8% of the total mean annual rainfall. GW distribution is very variable - Table. Groundwater Quantity and Distribution per Province
Copper contamination along Stream sediments – Copperbelt, Zambia Konkola Mine Nchanga M Mufulira Chambishi M Chibuluma M Nkana M
Challenges of Lusaka Comprises: Urban area, Peri-urban areas and farm plots
Water demand is a critical factor for Lusaka • Present demand depends on two main water sources : • What are the future water sources ? • The main categories of competing users • Lusaka Water & Sewerage Company Ltd (LWSC) • Private residential plots, small holdings & industrial sites 1. Groundwater: (Karstic carbonate & schist aquifers) 2. Surface Water (Kafue River 50Km & streams on the Plateau)
LUSAKA WATER AND SEWERAGE COMPANY LTD • Abstracts about 50% from aquifers in Lusaka urban and adjacent areas. • About 50% treated water comes from Kafue Rivers • Distributes water to about 40% of Lusaka Plateau. Current abstraction is estimated to be in the range of 50.265 × 10⁶m3 year-1 to 65.385 × 10⁶m3 year-1, which is already well over the annual recharge of 45.44 × 10⁶m3 year-1 at 8% of the annual rainfall.
PRIVATE PLOTS, SMALL HOLDINGS & INDUSTRIAL SITES • About 90% depend on groundwater (Boreholes & hand dug wells) • Water is used for domestic, agriculture and industrial purposes • Boreholes are constructed every year
Lusaka Population 1964 - 196,000 Population 2006 - 1.5 million THE SPOON OF PIPED WATER does NOT extend to the Peri-Urban areas Population Growth: • After Independence – free movement • mostly attributed to rural-urban migration especially of the youth in search of employment and • an influx of retirees and retrenched workers from privatized mines and other companies. • 60-70% of this population settled in more than 33 high-density unplanned settlements or peri-urban areas of Lusaka.
2. CHALLENGE: Peri-Urban (PU) areas in Zambia JICA (2001:1) defines peri-urban areas as unplanned urban settlements that are disorderly developed mainly due to the rapidly increasing population. There are 372 peri-urban areas in Zambia; only 191 (51%) of these are legalized (GKW Group, 2006). In Lusaka, there are 33 of them including Chaisa, Ngombe, Kalingalinga, Mtendere and George. Others are Kanyama, Chipata, Kamanga, Kalikiliki, Misisi, Chawama, Jack Compound, Mandevu
Misisi Comp Table 3: Peri - Urban Characteristic features Chawama Comp • Informal or formal settlements of unplanned origin: This unplanned nature is a hinderance to up-grading of services in the areas as it does not afford an easy layout of piped network in order to achieve desired higher levels of service (household connections) of 100% coverage.
Table 3: Peri - Urban Characteristic features 2. High density low cost housing units: 3. Severe service deficiencies (poor infrastructure): 4. Unprotected wells, boreholes & dilapidated small piped water networks as main water sources: Most of the PU areas, particularly in Lusaka, are located in low flat areas, which are discharge areas and as such they have high water table often sitting on excellent aquifer systems. • Poor water quality and supply: e.g “Too Numerous to Count (TNTC) (Zulu and Nyambe, 2001). • Poor public health with high disease prevalence: water borne diseases such as cholera. • High population density and growth rate: For example Kanyama with 198,686 people has a higher population compared to Kabwe with 176,758 (CSO, 2000), a planned municipality with WSS network. In planning coverage • High unemployment levels: The unemployment levels are highest among the youth.
Table 3: Peri - Urban Characteristic features (CNTD.) • Low income levels: • High illiteracy levels: • Sizeable number of skilled and talented human resource in various disciplines: Most of the retirees from formal employment find their new homes in PU areas. • Strong social, economic and religious activities: • Important market for goods and services: • Strong platform for political activities: • Poor sanitation with traditional pit latrine as the main type: • Haphazard solid waste and solid waste disposal: • High number of vulnerable groups (orphaned, elderly, physically challenged including HIV/Aids patients):
Table 3: Peri - Urban Characteristic features (CNTD.) • High mobility level: general migration of rural population in search of employment, there is a high level of in and out migration from PU areas. • Lack of social structure, strong community based organizations & governing bodies: PU areas lack the social structure based upon traditional leadership and traditional institutions as well as strong community based organizations. • High levels of vandalism: Due to high poverty levels, there is a high level of vandalism in PU areas and some large ones in large towns, a high level of crime exists. • ……………………………………………………………………………
2.2 Water Supply and Sanitation Peri-Urban areas in Zambia are faced with several challenges in the provision of water and sanitation One major challenge in Lusaka is the need to meet the demand for safe and adequate potable water, as well as the need to provide access to adequate sanitation for inter- alia so as to meet Lusaka's ever rapidly increasing population.
Kanyama population has grown to over 198,000 people Hydrogeology and geology map of the Lusaka area. The position of the Kanyama settlement is indicated. Modified from Nyambe and Maseka, 2000. Flow towards NW (mainly), SW and NE.
Some of these areas are used as dump sites for both liquid and solid waste disposal
Toilet under construction Karstic feature Kanyama is NOT on sewer line but it is depended on pit latrines commonly constructed to follow the hollows created by karstic solutions during the development of the Karstic dolomite (marble) aquifer. Completed Toilet Lack of sanitation facilities: mostly in form of Toilets with limited sewer facilities e.g. Lusaka peri-urban sitting on Karstic aquifer
4.Kanyama is depended on this Groundwater through shallow wells as there are few lines for piped-water
Threats to Quality comes from wastewater discharges, agriculture, deforestation, industry and mining e.gGW Quality in KanyamaTownship – Shallow Wells
Examples of Cost from Treating Cholera Patients – Money Spent on unbudgeted for Health Costs • Lusaka District had treated 739 Cholera cases last year 2004 • The average hospitalization length for 1 patient for rehydration and treatment was 5 days • The cost to treat one cholera patient successfully is US$450 for 5 days including staff overtime • For 739 patients X US$450 = US$332,550
Table 4: Summary of Access to Safe Water Supply in Zambia, 1990 – 2005 CSO, 2000. Zambia in Figures; CSO, 2004. Selected Socio-economic Indicators; CSO, 2004. Population Projections Report. Baseline Study completed in June 2006 indicates that in urban (including peri-urban) areas, water coverage is only adequate for about 50% clearly raising concerns on Zambia’s ability to attain the MDG by 2015.
Coverage trends – (1990 – 2015) Coverage/yr 1990 2000 2005 2015 Rural WS 58 29.5 37 75 Urban WS 85 86.1 86 95 Rural San. 5 4 13 60 Urban San. 54 33 43 80 Source: CSO Table 5: Summary of Access to Sanitation in Zambia, 1990-2005 Note: * Sanitation estimates have been worked out on basis of CSO (2000) definition of sanitary facility (i.e. Flush toilet and VIP latrine) ** Rural coverage uses “sanplat” as proper sanitation facility
Maputo city, on the other hand, with a population of ca. 3 million people and an area of 750 Km2 is one of the fastest growing cities in Mozambique. Over the last two decades one of the biggest challenges of the municipal authorities has been to secure a safe and clean source of water for domestic consumption for the fast growing urban population. Dar Es Salaam = Water supply coverage 74 % for 15 hrs per day • Water supply schemes very old and leaking • Leakage up to 47% internationally accepted 20% • 76 % meters connected • Increased Pollution • Sanitation 17 %
Due to the poor performance of the institutions charged with the management of the water sector, Government realized the need to reform the Water Sector, which started in the 1980s. This necessitated putting in place the National Water Policy of 1994(NWP, 1994) which set the framework for the development and management of the water sector in Zambia, a strategy (MLGH, 2001) to tackle issues in the policy, specifically for peri-urban areas and guidelines most of which have a bearing on PU areas. • For example, the principal Water Act governing the management of water resources dates from 1948 and fails to address key modern day issues such as the use and protection of groundwater, shared international waters, or customary law.
The main issues were: • Lack of a comprehensive sector policy or strategy to guide sector organisations in the performance of their tasks; • Unclear roles and responsibilities for the water sector leading either to duplication of efforts or gaps in some areas; • Deteriorating infrastructure as a result of poor maintenance and lack of new investments, with most of the investment being provided by external Support Agencies; • Erratic and insufficient funding through Government with little impact of government institutions on the ground;
Increasing pollution of water resources among other environmental problems, particularly in the mining areas; • Non-existence of comprehensive legislative framework for managing water (No sector policy on Water Resources Management (WRM) and Water Supply and Sanitation (WSS); the Water Act from 1948 was outdated and did not cover WSS); and • Lack of stakeholder involvement and ownership by consumers and users. The reforms have and are being strategically implemented into two: Reorganisation of the Water Supply and Sanitation sub-sector (WSS) from 1993 to date; and Reorganisation of Water Resources Management from 2001 to date.
In 1994 National Water Policy was therefore adopted to address the issues, with emphasis on strengthening framework for Water Resources Management following an integrated water resources management approach. The objective NWP: to promote sustainable water resources development with a view to facilitating adequate, equitable and good quality water for all users at acceptable costs and ensuring security of supply under varying conditions.
This objective was to be achieved through the following key policy strategies: • Recognising the important role of the water sector in the overall socio-economic development of the country • Vesting control of water resources in the country under state control. • Promoting water resources development through an integrated management approach. • Providing adequate, safe and cost effective water supply and sanitation services with due regard to environmental protection. • Defining clear institutional responsibilities of all stakeholders in the Water Sector for effective management and co-ordination. • Recognising water as an economic good
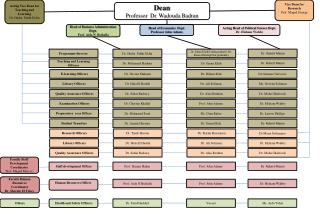
Starting with WSS sub-sector, the Government enacted the WSS Act. No 28, 1997 to address the poor performance to bring about an organisational change management and produced permanent structures (Fig. 3) • that has transformed the water supply and sanitation sub-sector into institutional change management with a focus on full cost recovery, efficient delivery, transparency, and sound financial management.