Download
1 / 35
350 likes | 448 Views
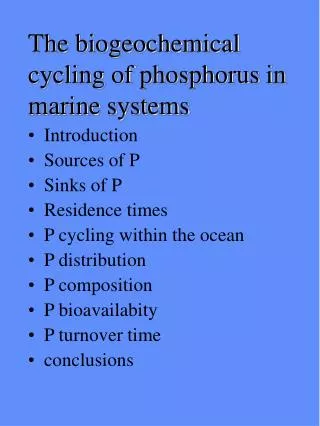
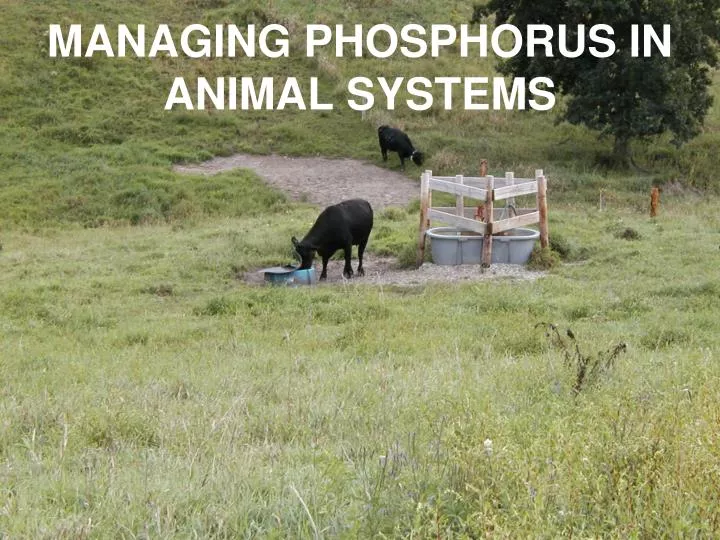
MANAGING PHOSPHORUS IN ANIMAL SYSTEMS. P CONCENTRATION IN IOWA LAKES (2001). CHANGE IN THE CONCENTRATION OF P IN MAN-MADE LAKES IN IOWA. LIVESTOCK AND LOADING OF P IN THE ENVIRONMENT. Concentration of livestock production

E N D
LIVESTOCK AND LOADING OF P IN THE ENVIRONMENT • Concentration of livestock production • 31% of farms in US have inadequate land to apply P from the manure produced • Manure from these farms represents 70% of the excess manure P produced • 5% of the counties have inadequate land to apply P from the manure produced • Manure from these counties represents 23% of the excess manure P
The low N:P ratio of manure relative to crop needs • CropN:P2O5 neededLivestockN:P2O5 excretedN:P2O5 available* Corn grain 2.5 Swine (G-F) 1.15 .88 (Slurry) Soybeans 4.26 Beef feedlot 1.41 .75 (Scraped) Alfalfa 4.5 Lactating dairy cow 2.45 .88 (Slurry) Bromegrass 3.88 Layer 1.15 .88 (Slurry) Corn silage 1.95 Turkey 1.17 .75 (Litter) *w/ incorporation • Results in excess P accumulation in soil if N is applied at the agronomic rate • Problem is enhanced by N volatilization
Low P retention % retained Growing cattle 21 Growing swine 27 Poultry 21 • Grazing cattle • Little P removed by grazing cattle • Most P is recycled to the soil • Pastures generally are not good places to repeatedly fertilize with swine and poultry manure unless periodically baled • Stream bank erosion • Poorly managed grazing may remove vegetation from stream banks allowing soil erosion • With increasing soil erosion, P pollution of streams will occur
FUNCTIONS OF P IN LIVESTOCK • Bone structure • 80% of the body’s P • Bound to calcium as hydroxyapatite crystals • Ca10 x(PO4)6(OH)2(H3O)2x • Ca:P ratio = 2:1 • Serves as a reserve source for Ca and P for other functions • Energy metabolism • Adenosine triphosphate (ATP) • Creatinine phosphate • Genetic structure • Nucleic acids • Cell membranes and organelles • Phospholipids • Phosphoproteins • Acid-base balance • Microbial growth and digestion in the rumen of ruminant animals
P DEFICIENCY SYMPTOMS • Bone abnormalities • Weak, bent, easily broken • In young animals, rickets • In adult animals, osteomalacia • Loss of appetite or depraved appetite • Animals eat unusual materials like pebbles, metals etc. • Behavior does not represent a ‘sense’ for P in feeds • Unthrifty appearance and loss of growth • Reduced milk production • In swine, paralysis of the hind limbs • In cattle, reduced fertility • Questionable concern • Only occurs when cattle are fed very low P levels (< .2%P) for long periods of time • May be the result of impaired feed digestion by not meeting the microbial needs
P IN FEEDS • P concentration in feeds • P concentration in most feeds except mature forages is moderate to high. Livestock speciesTotal P reqt. %Feed classFeedP, %DM Dairy cow Lactating .40 Energy conc Corn .30 Dry .25 Oats .40 Beef Cottonseed .60 Finishing steer .24 Protein conc Soybean meal .71 Lactating cow .22 Meat and bone 4.73 Dry cow .12 Grain Wheat mids 1.02 Swine processing Distillers grains .83 Growing-finishing .4 - .6 byproducts Corn gluten feed1.00 Sow .6 Forages Corn silage .28 Poultry Alfalfa hay .31 Layers .4 Grass hay .30 Broilers .4 Grass pasture .40 Turkeys .6 Corn stalks .09
Availability of P in feeds • 60 – 75% of P in grains, grain by-products, and oilseed meals is bound to form phytate • Phytate-phosphorus is unavailable to monogastric animals • Phytate-phosphorus is degraded by the enzyme, phytase, produced by the rumen bacteria in ruminant animals
P availability Swine and poultryCattle (% available) Corn and corn byproducts 15 70 Wheat 50 70 Soybean meal 25 70 Meat and bone meal 67 - Forages - 64 Dicalcium phosphate 100 70 Defluorinated phosphate 95 70 • Must compensate for the low availability of phosphorus from plant sources in monogastrics by supplementing mineral sources • Results in increase P excretion
P DIGESTION AND METABOLISM IN NONRUMINANTS Small intestine Phytate-P (60-75% of plant P) Excess Ca or high pH Feces Inorganic P Passive Active absorption transport Circulating P1,25(OH)2vitamin D kidney Bone (Low blood Ca or P) Soft tissue 25 (OH) vitamin D Excess (Circulating in blood) Liver Kidney Vitamin D (Diet or sunlight) Urine +
Factors affecting P absorption from the gut • Phytate • High phytate reduces P absorption • Ca:P ratio • Ca:P should be between 1:1 to 1.25:1 • Intestinal pH • High intestinal pH reduces P absorption • Vitamin D • Vitamin D deficiency reduces P absorption
STRATEGIES TO LIMIT P LOADING OF THE ENVIRONMENT BY NONRUMINANT ANIMALS • Increase availability of dietary P • Degrade phytate-P • Feed microbial phytase • Enzyme produced by fungus, Aspergillus sp. • Treatment • 200 to 1000 units/kg • 500 units = 90 gm/ton • Effects • Decrease P excretion by 30 to 50% • Increases availability of some other minerals and amino acids • Most activity occurs in stomach or gizzard • Optimal activity occurs at pH <4.0 • Effectiveness decreased if: • Excess Ca is fed • Vitamin D is deficient • Phytase is applied before pelleting feed Temperatures greater than 140 F destroys enzyme • Effectiveness improved if: • Fed as an enzyme cocktail with phosphatase, protease, citric acid, and pectinase
To reduce P excretion when using phytase, rations must be balanced to meet the available P requirement • Phytase can reduce the amount of inorganic P supplemented in swine and poultry diets by .1% unit or 25% • Example (Swine) 1000 head Farrow-finish % P in phasesManure P (lb P2O5/yr) Normal diet .60, .55, .50, .45 13,000 Phytase-treated .50, .45, .40, .35 8,900 • Economics of using phytase • Cost of phytase = cost of dicalcium phosphate saved • Genetically modify crops to contain phytase • Successful in corn and soybeans • Limitations • Susceptible to destruction from heating during processing • Difficulty in separating genetically modified crops from other varieties
Genetically modify swine to have phytase in saliva • Gene from Escherichia coli has been inserted into swine • Phytase secreted in saliva of GM pigs • Stable at pH 2.5 • Resistant to pepsin • Decreases P excretion by 60% • Limitations • Variable response • Regulator and consumer concerns with GMO foods Possible allergenicity to E. Coli proteins that are resistant to digestion in the stomach • Genetically modify crops to decrease phytate content • Reduces phytate content of corn and soybean meal Phytate-P, % of total P NormalLow phytate Corn 75 35 Soybeans 70 24 • Increases P bioavailability P bioavailability, % NormalLow phytate Corn 22-33 46-77 • Feeding low phytate corn and soybean meal may reduce P excretion by 50% when diets balanced for available P • Effects of low phytate crops and phytase on P excretion are additive
Limitations of low phytate crops • Low germination rates • 4 – 23% reduction in seed weight • Difficulties in separating grain hybrids • Addition of vitamin D metabolites • 1,25(OH)2 vitamin D increases P transport across intestinal wall • Has additive effects with phytase • Feeding 1,25 (OH)2 vitamin D and phytase can replace .2% units or 50% of the inorganic P added to chick diets • Limitation • Excess vitamin D may be toxic • Addition of probiotics • Probiotics are microbial cultures dosed or fed to establish a population of favorable bacteria • Feeding Lactobaccillus-based cultures increase P retention by 22% in chickens
Balance diets closer to the P requirements • Limit safety margins • Swine industry commonly feeds P at 120 – 155% of the NRC requirements Swine dietManure P, lb/pig .5% P 2.5 .6% P 3.5 • Current actual requirements for poultry are 40% less than recommended by NRC • Phase feeding • P requirement (as a % of diet) decreases as animals grow • Increasing number of phases to 4 or 5 or more will reduce P excretion by 10% • Limitation • Feeding and handling more diets • Separate sex feeding • P requirements for males > P requirements for females • Accurate ‘real-time’ feed composition • Book values are inaccurate • ‘Wet lab’ analysis of P and phytate-P is slow and expensive • Near infrared reflectance spectroscopy (NIRS) technology may help
Minimize feed variability • Natural variability • Processing • Pelleting may reduce P bioavailability • Proper weighing and mixing • Minimize feed waste • Each 1% increase in feed waste = .04 lb/pig increase of P in manure • Total potential for using available tools (phytase, low phytate corn, phase feeding, vitamin D) • Decreases P excretion by 40 to 60% in poultry • Decreases P excretion by 50 to 60% in swine
P DIGESTION AND METABOLISM IN RUMINANTS RumenSmall intestine Phytate-P Inorganic-P Undegraded Degraded Very little Feces (95-98% of Inorganic P excreted P) Microbes Passive Active absorption transport Circulating P 1,25(OH)2vitamin D kidney (Low Ca Recycled to digestive Bone or P) tract via saliva 25(OH)vitamin D (Supplies P to rumen Soft tissue microbes if diet is deficient; liver 80% of total P excreted) Excess Vitamin D Kidney (Diet or sunlight) Excreted (Very little) +
FACTORS AFFECTING P ABSORPTION IN RUMINANTS • Amounts of P consumed • High P intake reduces P absorption • Ca:P ratio • Optimum is 2:1 • Excess amounts of Al, Fe, Mg, Mn, K, and fat • Reduce P absorption by producing indigestible complexes • Intestinal pH • Lower intestinal pH increases P absorption • P source P availability, % Forages 64 Energy and protein concentrates 70 Mineral supplements 70 • Forage P concentration • High soil P increases forage P concentration • High forage P concentration reduces P absorption • Forage maturity • Forage P concentration decreases with maturity • Forage fiber digestion decreases with maturity decreasing P absorption
STRATEGIES TO REDUCE PHOSPHORUS LOADING OF THE ENVIRONMENT BY RUMINANTS • Do not overfeed P • Dairy % P in DMManure P, lb/cow/lactation Industry average .52 64.9 NRC requirement .32-.42 42.2 Adequate .35 34.8 Dry cow .25 - • Reasons for excess feeding • Belief that P supplementation will improve reproductive performance • Studies show no improvement in reproduction above .25% P • Aggressive marketing of P supplements • Beef feedlot Steer (600-1200 lb)Diet P, % of DM NRC requirement 0.20 – 0.30 Adequate in experiments 0.14 – 0.16 • Reasons for excess feeding • NRC requirement based on 1950 dairy cow data • High grain diets contain 0.3% and require no supplement
Beef cows Common P, Physiological P reqt, Seasonfeed% of DMstate% of DM Spring-summer Pasture 0.37-0.44 Lactating 0.22 Fall Corn stalks 0.09 Early gestation 0.12 Winter Grass-legume hay 0.26-0.34 Late gestation 0.16 • Implications • Phosphorus only need to be supplemented when grazing or fed very mature grass forages or crop residues • However, most producers supplement P year-round
P CONCENTRATION IN CLIPPED FORAGE FROM SMOOTH BROMEGRASS PASTURES AT RHODES RESEARCH FARM AND REQUIREMENTS OF SPRING-CALVING COWS
P CONCENTRATION OF FORAGE THAT WAS HAND-CLIPPED OR SELECTED BY GRAZING CATTLE FROM SMOOTH BROMEGRASS PASTURES WITH DIFFERENT GRAZING MANAGEMENT Grazing management ForageGrazeGraze/hay % phosphorus Hand-clipped 0.41 0.53 Selected by grazing 0.60 0.63
Reasons for excess P feeding • Belief that continuous P supplementation is needed for reproductive performance • Ease of supplementing minerals free choice to provide safety margin • Results of feeding excess P • Increases amount of P excreted • Increases the solubility of the P excreted • Amount of P lost in run-off increased 4 times if dairy cow diets contain .5%P vs. .4%P • Increased feed costs
Difficulty in lowering P in ruminant diets • High concentration of P in grains and grain by-products • Grains contain adequate P (0.3%) to meet requirements of feedlot cattle without supplement • Grain by-products • Contain high concentrations of P P, % DM Wheat mids 1.02 Distillers grains 0.90 Corn gluten feed 1.00 • A large increase in ethanol plants will increase the amounts of distillers grains available 75% of distillers grains are fed to beef cattle A diet containing 40% distillers grains will contain 0.55% P • If by-products are fed, more land will be needed to apply at an agronomic rate
Effects of using distillers grains for feeding cattle on land base for manure application • Assumptions • 2500 head feedlot with 2 groups per year • Average weight, 975 lb • lb P2O5/lb animal weight/year = .078 (Corn based diet) or .156 (Distillers grains diet) • Broadcast application = 70% P availability • ½ cropground available for land application • Corn production, 200 bu/ac • Corn P2O5 uptake = .36 lb/bu Corn, 1.9 miles Distillers grains 2.7 miles
Feeding ionophores • Chemical feed additives that affect mineral transport across membrane • Common ionophores • Monensin (Rumensin) • Lasalocid (Bovatec) • Reduces P excretion • Monitor feed status • Analyse feeds • Books values are inadequate • Condition score cows • Measure of cow fatness • Scale (1 – 9) • 1 = very thin • 5 = desired • 9 = very fat • If cows < condition score 5, analyse diet for energy, protein and minerals • P solubility in feces • No soluble P means inadequate P in diet
Feed high quality forages • Immature, high quality forages contain more P that is more digestible than mature forages • Avoid excess calcium in diet • Use improved grazing management practices • Properly managed rotational grazing should limit P loss in soil erosion from both upland and riparian areas • Bale some pasture forage to remove P and to keep the remainder of the pasture immature • Only fertilize pastures with P based on soil analyses • Strategic supplementation to grazing cattle • Only supplement if grazing mature forage on low P soil • Limit use of free choice mineral • In future, may be able to feed grains that are genetically modified for a lower P content.
POTENTIAL TO DECREASE P EXCRETION BY RUMINANTS • Dairy • 20% decrease in dietary P • 25 – 30% decrease in manure P • 50% decrease in P run-off from land • Beef • 33% decrease in dietary P • 40% decrease in manure P (5.1 lb P/steer)
MANURE HANDLING AND STORAGE TO MINIMIZE P LOADING OF THE ENVIRONMENT • Goals • Maintain N:P ratio • Use strategies to minimize N loss • Minimize P loss • Minimize precipitation run-off • P loss from lots and storage facilities is low if run-off is minimized • Strategies • Catch run-off from lots and storage areas • Divert clean water from lots and storage areas • Minimize the solubility of P in manure • Gravity settling and mechanical separators will remove 15 to 25% of the P in liquid manure • P decreases in the liquid fraction of manure in lagoons and increases in the sludge • 65% of the P in manure will be in the sludge • Addition of aluminum sulfate, magnesium chloride, ferric chloride, and some Ca salts will precipitate P from liquid manure in the solids fraction • Enhance manure transport from farm • Compost