Download
1 / 22
220 likes | 378 Views
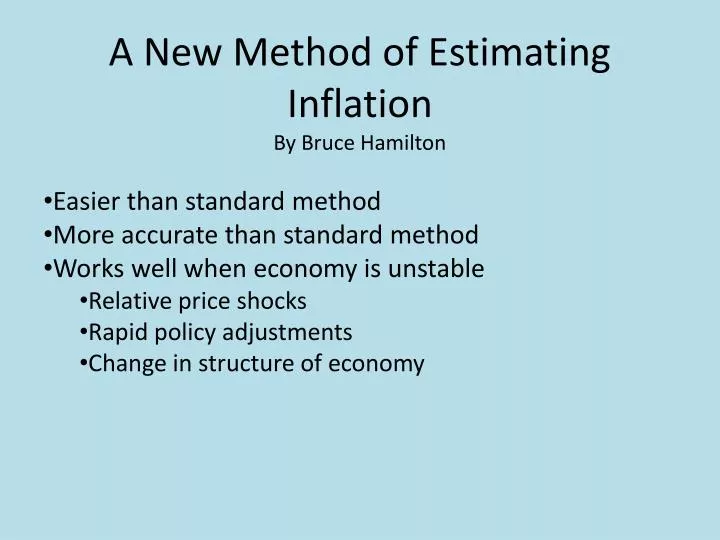
A New Method of Estimating Inflation By Bruce Hamilton Easier than standard method More accurate than standard method Works well when economy is unstable Relative price shocks Rapid policy adjustments Change in structure of economy. I . How Inflation is Measured

E N D
A New Method of Estimating Inflation By Bruce Hamilton • Easier than standard method • More accurate than standard method • Works well when economy is unstable • Relative price shocks • Rapid policy adjustments • Change in structure of economy
I. How Inflation is Measured • Define a Consumption Bundle This is (supposed to be) the bundle of goods bought by a typical consumer in a month. This bundle is updated very rarely.
Observe the prices of all of the goods in the Consumption Bundle in month t: {p1t,…,pnt} • Multiply and get the cost of the bundle at time t:
Pick base period 0 • Arbitrarily set CPI0 = 100 • Future values of CPI given by • If CPIt = 110 there has been 10% inflation since t0. • Annual inflation is % growth in CPI.
Problems with Traditional Method • New Products • Unmeasured Technical Progress • Substitution Bias NOTE: All biases tend to OVERSTATE inflation
Substitution Bias (When relative prices change, consumers can substitute away from newly expensive goods) • 2 goods, x1 and x2 • p1 rises, p2 unchanged • What happens to Cost of Living?
x1 Consumption Bundle x2
Black: C0 (time-0 cost of bundle) • Red: Budget constraint when P1 rises • Purple: C1 (time-1 cost of original bundle) • Green: True C1 (cost of reference indifference curve in period 1) • The height of line C overstates inflation between periods 0 and 1 because consumers substitute away from x1.
CPI growth (inflation) overstated when --- • Relative prices changing • Innovation in products or economy rapid Fixing CPI VERY difficult • Measure and value each quality change • Estimate benefits of substitution
III. Estimating Inflation with Engel Curves Engel’s Law: Food budget share declines as income rises
Graphical Demonstration 2008 2009
2008 and 2009 Engel Curves “should” be same • If they are not, assume p2009 is overstated => y2009 is understated • Experimentally reduce p2009 (raising y/p) until two Engel curves overlap. • Use “corrected” p2009 as new measure of inflation.
In graph above: If 2009 consumers ACT rich (low food share of expenditure) We will assume they really ARE rich and we didn’t know it because we overstated inflation
Translate this idea into estimating equation: Data on individual households • Income • Food Expenditure • Year • Family Structure
ωit is household i’s food budget share in year t • Dt =1 in year t Dt = 0 otherwise • Xit are household characteristics • If CPIt is correct, all αt‘s = 0 • If αt < 0, CPIt biased upward • Use αt values to estimate correct CPI
Data Requirements very limited • Ideal for countries with poor central data-gathering services • Superior (I think) for countries undergoing rapid economic transformation
IV Other Applications Russia 1991-2001 (John Gibson,, Steven Stillman and Trinh Le, 2008. CPI Bias and Living Standards in Russia During the Transition, Journal of Development Economics, Vol. 87, pp. 140-160.) • Dismantle command economy • Wild changes in relative prices • Huge quality improvements in goods • Huge improvements in distribution system • CPI inflation overstated up to 1% PER MONTH (1992-2001) when not using “corrected” CPI
Brazil Irineu de CarvalhoFilho and Marcos Chamon, 2009. “The Myth of Post-Reform Income Stagnation: Evidence from Brazil and Mexico,” IMF Working Paper. • Major Economic Reforms in mid 1980s • Relax exchange controls • Relax import restrictions • Relax controls on domestic economy • Economic results 1988-2003 (income/household) • Official: 1.5% growth • CPI corrected: 4.5% annual growth • Cumulative difference 55%
Mexico 1984-2006 • Major reforms including NAFTA • Official results disappointing (2%) • Corrected results impressive (4.5 – 5.5%)