Download
1 / 19
210 likes | 662 Views
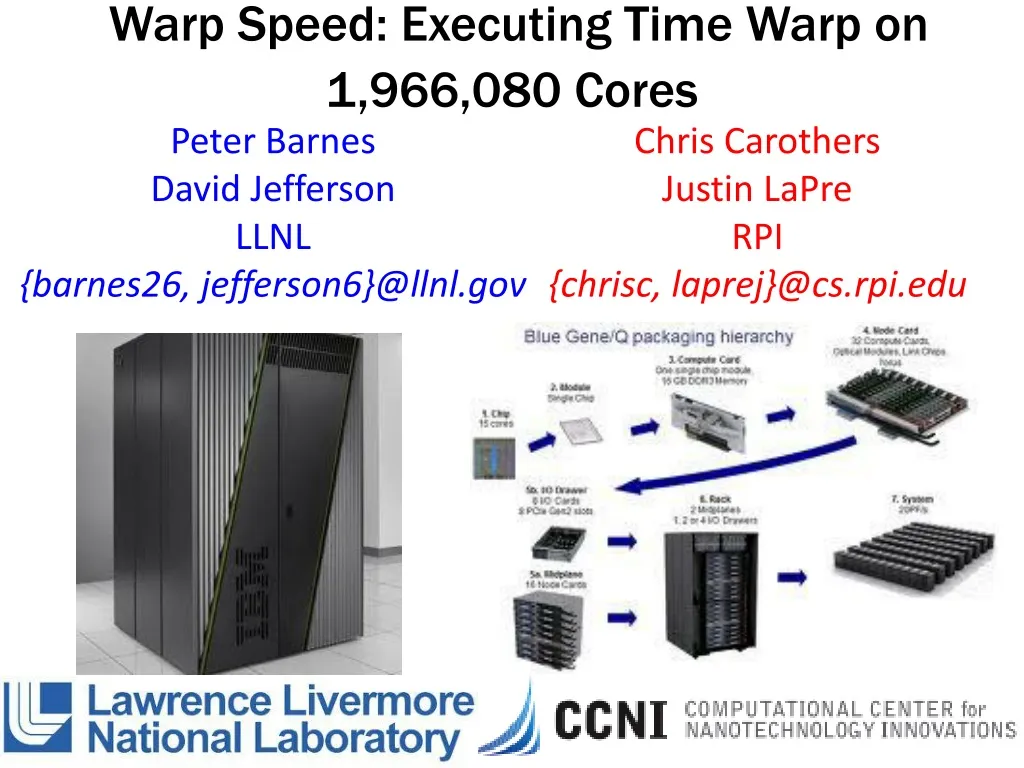
Peter Barnes David Jefferson LLNL {barnes26, jefferson6}@llnl.gov. Warp Speed: Executing Time Warp on 1,966,080 Cores. Chris Carothers Justin LaPre RPI {chrisc, laprej}@cs.rpi.edu. Outline. Motivation Blue Gene/Q CCNI LLNL’s Sequoia ROSS Implementation PHOLD Scaling Results

E N D
Peter Barnes David Jefferson LLNL {barnes26, jefferson6}@llnl.gov Warp Speed: Executing Time Warp on 1,966,080 Cores Chris Carothers Justin LaPre RPI {chrisc, laprej}@cs.rpi.edu
Outline • Motivation • Blue Gene/Q • CCNI • LLNL’s Sequoia • ROSS Implementation • PHOLD Scaling Results • Performance History • What’s Next
Motivation • David Jefferson, Peter Barnes (left) and Richard Linderman (right) contacted Chris to see about doing a repeat of the 2009 ROSS/PHOLD performance study using the “Sequoia” Blue Gene/Q supercomputer • AFRL’s purpose was to use the scaling study as a basis for obtaining a Blue Gene/Q system as part of HPCMO systems • Goal: (i) to push the scaling limits of massively parallel discrete-event simulation and (ii) determine if the new Blue Gene/Q could continue the scaling performance obtained on BG/L and BG/P. • We thought it would be easy and straight forward …
IBM Blue Gene/Q Architecture • 1.6 GHz IBM A2 processor • 16 cores (4-way threaded) + 17th core for OS to avoid jitter and an 18th to improve yield • 204.8 GFLOPS (peak) • 16 GB DDR3 per node • 42.6 GB/s bandwidth • 32 MB L2 cache @ 563 GB/s • 55 watts of power • 5D Torus @ 2 GB/s per link for all P2P and collective comms • 1 Rack = • 1024 Nodes, or • 16,384 Cores, or • Up to 65,536 threads or MPI tasks • 1.6 GHz IBM A2 processor • 16 cores (4-way threaded) • 16 GB DDR3 per node • 42.6 GB/s bandwidth • 32 MB L2 cache • 204.8 GFLOPS (peak) • 55 watts of power • 5D Torus @ 2 GB/s network 1 Node • 1 Rack = • 1024 Nodes, or • 16,384 Cores, or • Up to 65,536 threads or MPI tasks
“Balanced” Supercomputer @ CCNI • IBM Blue Gene/Q • Phase 1: 420+ teraFLOPS @ 2+ GF/watt • 10PF and 20PF DOE systems • 21 BG/Q systems in Top500 • Exec Model: 64K threads/16K cores • 32 TB RAM • 64 I/O nodes (4x over other BG/Qs) • RAM Storage Accelerator/Clusters • 8 TB @ 50+ GB/sec • 32 Intel servers @ 256 GB each • Doubles as a compute clusters • Disk storage: 1.2 Petabytes • 32 servers @ 24 TB disk • Bandwidth: 5 to 24 GB/sec • Viz systems @ CCNI & EMPAC • FDR 56 Gbit/sec Infiniband core network • EXASCALE PATH ARCHITECTURE!
LLNL’s “Sequoia” Blue Gene/Q • Sequoia: 96 racks of IBM Blue Gene/Q • 1,572,864 A2 cores @ 1.6 GHz • 1.6 petabytes of RAM • 16.32 petaflops for LINPACK/Top500 • 20.1 petaflops peak • 5-D Torus: 16x16x16x12x2 • Bisection bandwidth ~49 TB/sec • Used exclusively by DOE/NNSA • Power ~7.9 Mwatts • “Super Sequoia” @ 120 racks • 24 racks from “Vulcan” added to the existing 96 racks • Increased to 1,966,080 A2 cores • 5-D Torus: 20x16x16x12x2 • Bisection bandwidth did not increase
ROSS: Local Control Implementation Local Control Mechanism: error detection and rollback V i r t u a l T i m e • ROSS written in ANSI C • Executes on Blue Gene, Cray XT3/4/5, SGI and Linux clusters • Reverse computation used to implement event “undo”. • MPI_Isend/MPI_Irecv used to send/recv off core events. • Event & Network memory is managed directly. • Pool is allocated @ startup • AVL tree used to match anti-msgs w/ events across processors • Event list keep sorted using a Splay Tree (logN). • LP-2-Core mapping tables are computed and not stored to avoid the need for large global LP maps. (1) undo state D’s (2) cancel “sent” events LP 2 LP 3 LP 1
ROSS: Global Control Implementation Global Control Mechanism: compute Global Virtual Time (GVT) V i r t u a l T i m e GVT (kicks off when memory is low): • Each core counts #sent, #recv • Recv all pending MPI msgs. • MPI_Allreduce Sum on (#sent - #recv) • If #sent - #recv != 0 goto 2 • Compute local core’s lower bound time-stamp (LVT). • GVT = MPI_Allreduce Min on LVTs Algorithms needs efficient MPI collective LC/GC can be very sensitive to OS jitter (17th core should avoid this) collect versions of state / events & perform I/O operations that are < GVT GVT LP 2 LP 3 LP 1 So, how does this translate into Time Warp performance on BG/Q
PHOLD Configuration • PHOLD • Synthetic “pathelogical” benchmark workload model • 40 LPs for each MPI tasks, ~251 million LPs total • Originally designed for 96 racks running 6,291,456 MPI tasks • At 120 racks and 7.8M MPI ranks, yields 32 LPs per MPI task. • Each LP has 16 initial events • Remote LP events occur 10% of the time and scheduled for random LP • Time stamps are exponentially distributed with a mean of 0.9 (i.e., lookahead is 0.10). • ROSS parameters • GVT_Interval (512) number of times thru “scheduler” loop before computing GVT. • Batch(8) number of local events to process before “check” network for new events. • Batch X GVT_Interval events processed per GVT epoch • KPs (16 per MPI task) kernel processes that hold the aggregated processed event lists for LPs to lower search overheads for fossil collection of “old” events. • RNGs: each LP has own seed set that are ~2^70 calls apart
PHOLD Implementation void phold_event_handler(phold_state * s, tw_bf * bf, phold_message * m, tw_lp * lp) { tw_lpid dest; if(tw_rand_unif(lp->rng) <= percent_remote) { bf->c1 = 1; dest = tw_rand_integer(lp->rng, 0, ttl_lps - 1); // Makes PHOLD non-deterministic across processors! Don't uncomment /* dest += offset_lpid; */ /* if(dest >= ttl_lps) */ /* dest -= ttl_lps; */ } else { bf->c1 = 0; dest = lp->gid; } if(dest < 0 || dest >= (g_tw_nlp * tw_nnodes())) tw_error(TW_LOC, "bad dest"); tw_event_send( tw_event_new(dest, tw_rand_exponential(lp->rng, mean) + LA, lp) ); }
CCNI/LLNL Performance Runs • CCNI Blue Gene/Q runs • Used to help tune performance by “simulating” the workload at 96 racks • 2 rack runs (128K MPI tasks) configured with 40 LPs per MPI task. • Total LPs: 5.2M • Sequoia Blue Gene/Q runs • Many, many pre-runs and failed attempts • Two sets of experiments runs • Late Jan./ Early Feb: 1 to 48 racks • Mid March: 2 to 120 racks • Sequoia went down for “CLASSIFIED” service on March ~14th
Impact of Multiple MPI Tasks per Core Each line starts at 1 MPI tasks per core and move to 2 MPI tasks per core and finally 4 MPI tasks per core At 2048 nodes, observed a ~260% performance increase from 1 to 4 tasks/core Predicts we should obtain ~384 billion ev/sec at 96 racks
Detailed Sequoia Results: Jan 24 - Feb 5 75x speedup in scaling from 1 to 48 racks w/ peak event rate of 164 billion!!
Excitement, Warp Speed & Frustration • At 786,432 cores and 3.1M MPI tasks, we where extremely encouraged by ROSS’ performance • From this, we defined “Warp Speed” to be: Log10(event rate) – 9.0 • Due to 5000x increase, plotting historic speeds no longer makes sense on a linear scale. • Metric scales 10 billion events per second as a Warp1.0 • However…we where unable to obtain a full machine run.. • Was it a ROSS bug?? • How to debug at O(1M) cores?? • Fortunately NOT a problem w/ ROSS! • The PAMI low-level message passing system would not allow jobs larger than 48 racks to run. • Solution: wait for IBM Efix, but time was short..
Detailed Sequoia Results: March 8 – 11 • With Efix #15 coupled with some magic env settings: • 2 rack performance was nearly 10% faster • 48 rack performance improved by 10B ev/sec • 96 rack performance exceeds prediction by 15B ev/sec • 120 racks/1.9M cores 504 billion ev/sec w/ ~93% efficiency
PHOLD Strong Scaling Performance 97x speedup for 60x more hardware Why? Believe it is due to much improved cache performance at scale E.g, at 120 racks each node only requires ~65MB, thus most data is fitting withinthe 32 MB L2 cache
PHOLD Performance History “Jagged” phenomena attributed to different PHOLD config 2005: first time a large supercomputer reports PHOLD performance 2007: Blue Gene/L PHOLD performance 2009: Blue Gene/P PHOLD performance 2011: CrayXT5 PHOLD performance 2013: Blue Gene/Q
Next Steps & Future Work • Summary: Demonstrated highest PHOLD performance to date • 504 billion ev/sec on 1,966,080 cores Warp 2.7 • PHOLD has 250x more LPs and yields 40x performance improvement over previous BG/P performance (2009) • Reaching the point where our simulation capability is limited more by our ability to develop, maintain, and validate models than by our ability to execute them. • Short/medium term: • Scaling & results of models beyond PHOLD on BG/Q • E.gExascale storage models, Gate-level simulation • Further scaling of conservative approaches • Examine strong scaling on CrayXT systems (AFRL) • Understand how 5-D Torus network impacts performance • E.g. 2 rack @ 8x8x4x4x2 vs 96 rack @ 16x16x16x12x2 • Understand how Dragonfly (Cray XC30) network impacts performance • Hope to see improved GVT performance as ALL nodes are only 3 hops away! • Longer term: investigate “planetary” scale networks that have potentially billions of simulation entities/agents
Thank You! ACKNOWLEDGEMENTS: This work was performed under the auspices of the U.S. Department of Energy by Lawrence Livermore National Laboratory under contract DE-AC52-07NA27344, and Argonne National Laboratory (``Argonne'') under Contract No. DE-AC02-06CH11357. This research used the Sequoia IBM Blue Gene/Q computing resources at Lawrence Livermore National Laboratory, and additional Blue Gene/Q computing resources were provided by the Computational Center for Nanotechnology Innovations (CCNI) located at Rensselaer Polytechnic Institute. Part of the CCNI’s Blue Gene/Q was acquired using funds from the NSF MRI Program, Award #1126125. Prof. Carothers' time was supported by AFRL Award FA8750-11-2-0065 and DOE Award DE-SC0004875.