Download
1 / 25
250 likes | 355 Views
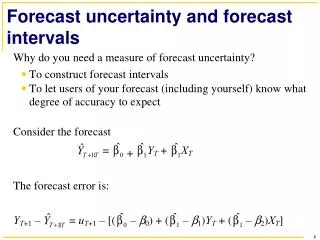
Assessing Forecast Uncertainty in the NDFD. Report to MDL Matt Peroutka, Greg Zylstra, John Wagner July 1, 2005. Overview. Overall Process Methods Data Sources Transformation to Percentiles Diagnostic Data Results Transformation to Percentiles Modeling the Joint Distribution

E N D
Assessing Forecast Uncertainty in the NDFD Report to MDL Matt Peroutka, Greg Zylstra, John Wagner July 1, 2005
Overview • Overall Process • Methods • Data Sources • Transformation to Percentiles • Diagnostic Data • Results • Transformation to Percentiles • Modeling the Joint Distribution • Diagnostic Data • Plans
What’s in a name? • NDFD UNCertainty Assessment (NUNCA) • Numerical Uncertainty Assessment of NDFD via Climatology and Ensembles (NUANCE)
Data Sources • Ideally, NDFD grids and Analysis of Record • Prototype with NDFD points and METAR observations • October 2004 to April 2005, inclusive • US Historical Climatological Network (USHCN) • Ensemble MOS (ENSMOS) archives • One bulletin from control run • Five bulletins created from runs with positive perturbations • Five bulletins created from runs with negative perturbations
Transformation to Percentiles • Addresses lack of cases in development data with extreme values of f or x. • Encourages combining of data. • NDFD has a short history. • NDFD includes a variety of forecasting techniques.
Diagnostic Data • Standard Deviation (SD) of 11 ENSMOS forecasts. • “Ensemble Deviation” (ED) • Difference each perturbed forecast with control forecast; • Compute r. m. s.
Results: Transformation to Percentiles • Obtained daily MaxT observations for 168 stations from USHCN. • Percentile function computed at 5-day intervals throughout the year. • Standard probability distributions used to model distribution. • Percentile function fitted to observations. • Fit parameters expressed as cosine series over day of the year. • Quality of fit judged subjectively. • Additional terms added to cosine series, if needed.
Results: Modeling Joint Distribution • Modeling p(f,x,d) straightforward for prototype. • Small number of stations. • All values can be retained in memory. • Will be re-designed for grids.
Results: Diagnostic Data • Stratified scatter diagrams for day 7 • ED < 6 °F • ED ≥ 6 °F
Results: SD vs. ED • NDFD percentile errors binned (interval 0.1 °F) by associated ED/SD value. • Plot NDFD percentile error vs. ED/SD.
Future Plans • Quantitatively assess uncertainty. • Variations by forecast projection. • Expand to include MinT. • Prototype products. • 50% confidence interval around NDFD • Probability Density Function • Exceedence probabilities for key values