Download
1 / 12
120 likes | 230 Views
A New Business Statistics in Finland - Quarterly Investments. OECD Short-term Economic Statistics Working Party meeting 23-24 June 2008. Development project: What are data on investments needed for?.

E N D
A New Business Statistics in Finland - Quarterly Investments OECD Short-term Economic Statistics Working Party meeting 23-24 June 2008
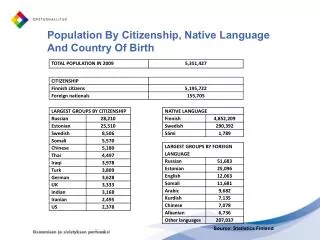
Development project: What are data on investments needed for? • A project for the development of short-term investment statistics between January 2007 and May 2008. • During the projectdata collection was launched,calculation method and production system were designed and implemented, production of the statistics was initiated. • Underlying is Regulation (EC) No 1161/2005 on the compilation of quarterly non-financial accounts by institutional sector, which requires quarterly data to be produced on fixed capital formation in all sectors of the national economy. • No adequate data were available before. The need for the data primarily concerned non-financial corporations and housing corporations (“the enterprise sector”). • The statistics describe investments of the enterprise sector into Finland without breakdown by industry. Tietopalveluyksikkö/Viestintä
Data collection: Sample, inquired variables • A new data collection was necessary. • The sample is comprised of approximately 1.900 of the largest enterprises in their respective industries. • The questionnaire asks enterprises about increases and decreases in their fixed assets by type of investment. The types of investment are:- building and structures - machinery and equipment- other tangible assets- computer software • The sample is updated once a year. • In addition to the annual valuation, the coverage of the sample needs continuous monitoring.Special care must be taken to ensure that new, major investments are covered by the inquiry. Tietopalveluyksikkö/Viestintä
The calculation methods • In accordance with the inquiry the variables are:- net building and structures - net machinery and equipment- net other tangible assets - net computer software- net investments total • Investments are calculated by the summation method without assuming paired comparability. The method requires that the data of the entire enterprise sector is covered. =>(1) The sample enterprises: the target response rate 90 % or more(2) The non-response enterprises: missing data are imputed(3) The non-sampled enterprises: an alternative method of estimation Tietopalveluyksikkö/Viestintä
Calculations with the sample • The data of the sampled enterprises are summed up to net investments by type of investment. • Before the summing the most important observations are studied at the enterprise level. => The validity of large observations is verified by additional questions of whether the investments were made into the enterprise sector. • The additional questions:(1) a new or used investment commodity? (If used, an additional question follows:)(2) does the other party to the transaction represents the enterprise sector? • New acquisitions are accepted as such. • Used investment commodities: Transactions with partied outside the enterprise sector (e.g. the financial sector) are accepted as such.If both parties represent the enterprise sector: transactions with parties outside the sample are eliminated in order to arrive at the best possible net value. Tietopalveluyksikkö/Viestintä
Imputation • Imputation methods (in the preferred order):(1.1) the data of the inquiry; mean for the nearest three months if the volatility of investments is low.(1.2) the data of the inquiry; mean for the nearest 9-12 months if investments fluctuate strongly.(2) the annual data; uniform distribution. When more quarterly data become available, the imputations can be revised by means of seasonal adjustment.(3) significant non-respondent enterprises are estimated by hand, by searching information about their investments from diverse sources (profit accounts, quarterly reviews, etc.) Tietopalveluyksikkö/Viestintä
Calculation for the non-sample • Approximately half of the value of investments is made into the non-sampled population. • Investments of the non-sampled enterprises will be estimated with (1) Annual data on investments:(1.1) Statistics Finland collects data on fixed assets from approximately 4.200 enterprises. More than half of these enterprises belong to the non-sampled population of the quarterly statistics. The inquired variables are the same in annual and quarterly data collections.(1.2) Near total data concerning investments in buildings and machinery are obtained from administrative sources.(2) Administrative data on turnover (so-called tax payment control data / value added tax data)The administrative file contains monthly data on turnover for all enterprises whose annual turnover is at least EUR 8.500 => total data that covers the entire enterprise sector. Tietopalveluyksikkö/Viestintä
The “ingredients” of the non-sample method: • (1) investments / turnover -ratio (invA / tuA)calculated by industry and type of investment using annual data on investments and the administrative data on turnover on the same period. • (2) turnover (tuQ) by industry for the quarter to be calculated. • For example, manufacturing enterprises’ investments in machinery are calculated using these ingredients by the following formula:invQ = invA / tuA * tuQ • where invnv is the estimated value of investments per industry and type of investment for the quarter to be calculated. • A rough breakdown by industry: manufacturing (NACE Rev. 1.1 = D), energy (E), construction (F), services1 (H-I), services2 (K), services3 (O), trade (G) and other (A,B,C,M,N). Tietopalveluyksikkö/Viestintä
Investment / turnover -ratio is expected to be approximately constant from year to year. • It was discovered in empirical data analyses that the ratio varies less between different years with small enterprises (i.e. non-sampled population) than with large enterprises (i.e. sampled population). • The stability of the ratio varies by type of investment:The administrative annual data covers (almost) the entire population on investments in machinery and buildings.The annual data on other tangibles and software are quite deficient (because these variables are not recorded in administrative files). • The correlation between the development of turnover and investments on the aggregate level:Machinery and equipment: is good in all industries.Buildings: is good in most industries.However, the connection was not clear in manufacturing (NACE Rev 1.1 = D) and energy supply (E) even though the coefficients were quite stable.Software: best correlation in manufacturing, construction (F) and in certain services (O).Other tangible investments: the method is problematic (this type of investment is the least significant.) Tietopalveluyksikkö/Viestintä
The data on the investments of the non-sampled population are methodologically inflated to describe the investments of the entire enterprise sector (sample excluded):Although the annual data on investments do not cover the entire enterprise sector, the investment/turnover ratio is presumed to describe the respective ratio for an entire industry (excl. sample).Multiplying an industry’s turnover in the reference quarter by this ratio produces an estimate of investments for the entire industry (excl. sample). • Values of investments are calculated by industry and type of investment, and then finally summed up to aggregate levels (all industries, all types of investments and all investments). Tietopalveluyksikkö/Viestintä
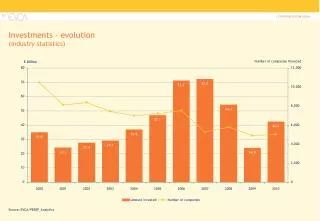
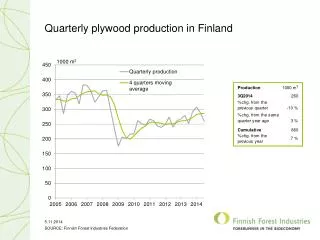
On the results • Relevant data to compare the results are not available. Annual data on the overlapping time period is not available until June when preliminary data will be released for 2007. • So far it has only been possible to compare the data with Statistics Finland’s figures for 2006 and with scattered data collected from other sources. The results seem “reasonable”. • The total value of investments was EUR 14.3 billion in 2007.In the first quarter of 2008. • Investments into Finland were up by 17 per cent on the respective quarter of 2007. The investments of - the sampled population grew by 23 per cent- the non-sampled population grew by 14 per cent from the previous year Tietopalveluyksikkö/Viestintä
Future? • For the time being, data on investments are only provided for national accounts calculations • The aim is to start their public releasing in two to three years. • The eventually published data could describe the enterprise sector’s investments by main activity group (manufacturing, construction, trade and other services), and maybe even by type of investment. Tietopalveluyksikkö/Viestintä