Download

1 / 47
630 likes | 1.76k Views
Atomic UV-Visible Spectroscopy. Lecture Date: January 28 th , 2013. Electronic Spectroscopy. Spectroscopy involving energy level transitions of the electrons surrounding an atom or a molecule. Atoms: electrons are in hydrogen-like orbitals (s, p, d, f).

E N D
Atomic UV-Visible Spectroscopy Lecture Date: January 28th, 2013
Electronic Spectroscopy • Spectroscopy involving energy level transitions of the electrons surrounding an atom or a molecule Atoms: electrons are in hydrogen-like orbitals (s, p, d, f) Molecules: electrons are in molecular orbitals (HOMO, LUMO, …) From http://education.jlab.org (The LUMO of benzene) (The Bohr model for nitrogen)
UV-Visible Spectroscopy • Definition: Spectroscopy in the optical (UV-Visible) range involving electronic energy levels excited by electromagnetic radiation (often valence electrons). • Techniques discussed in this lecture are related to the “high-energy” (“non-optical”) methods covered in the X-ray spectroscopy lecture. • Methods discussed in this lecture: • Atomic absorption • Atomic emission • Laser induced breakdown spectroscopy • Atomic fluorescence
The Electromagnetic Spectrum • UV-Visible
Elemental Analysis • Elemental analysis – qualitative or quantitative determination of the elemental composition of a sample • Atomic UV-visible spectroscopic methods are heavily used in elemental analysis • Other elemental analysis methods not discussed here: • Mass spectrometry (MS), primarily ICP-MS • X-ray methods (XRF, SEM/EDXA, Auger spectroscopy, XPS, etc…) • Radiochemical or radioisotope methods • Classical methods (e.g. color tests, titrations)
Definitions of Electronic Processes • Absorption: radiation selectively absorbed by molecules, ions, or atoms, accompanied by their excitation (or promotion) to a more energetic state. • Emission: radiation produced by excited molecules, ions, or atoms as they relax to lower energy levels.
The Absorption Process • Electromagnetic radiation travels fastest in a vacuum • When EM radiation travels through a substance, it can be slowed by propagation “interactions” that do not cause frequency (energy) changes: • Absorption does involve frequency/energy changes, since the energy of EM radiation is transferred to a substance, usually at specific frequencies corresponding to natural atomic or molecular energies • Absorption occurring at optical frequencies involves low to moderate energy electronic transitions c = the speed of light (~3.00 x 10⁸ m/s) i = the velocity of the radiation in the medium in m/s ni = the refractive index at the frequency i
P0 P Absorption and Transmission • Transmittance: T = P/P0 • Absorbance: A = -log10 T = log10 P0/P b A is linear vs. b! (A preferred over T) Graphs from http://teaching.shu.ac.uk/hwb/chemistry/tutorials/molspec/beers1.htm
The Beer-Lambert Law and Quantitative Analysis • The Beer-Lambert Law (a.k.a. Beer’s Law): • A =ebc • Where the absorbance A has no units, since A = log10 P0 / P • e is the molar absorbtivity with units of L mol-1 cm-1 • b is the path length of the sample in cm • c is the concentration of the compound in solution, expressed in mol L-1 (or M, molarity) • Beer’s law can be derived from a model that considers infinitesimal portions of a “block” absorbing photons in their cross-sections, and integration over the entire block • Beer’s law is derived under the assumption that the fraction of the light absorbed by each thin cross-section of solution is the same • See pp. 302-303 of Skoog, et al. for details
Deviations From the Beer-Lambert Law • Deviations from Beer’s law (i.e. deviations from the linearity of absorbance vs. concentration) occur from: • Intermolecular interactions at higher concentrations • Chemical reactions (species having different spectra) • Peak width/polychromatic radiation • Beer’s law is only strictly valid with single-frequency radiation • Not significant if the bandwidth of the monochromator is less than 1/10 of the half-width of the absorption peak at half-height. For an alternative view, see: Bare, William D. A More Pedagogically Sound Treatment of Beer's Law: A Derivation Based on a Corpuscular-Probability Model, J. Chem. Educ.2000,77, 929.
Deviations from the Beer-Lambert Law • Intermolecular interactions at higher concentrations cause deviations, because the spectrum changes Dimers, oligomers Figure from Chapter 5 of Cazes, Analytical Instrumentation Handbook 3rd Ed. Marcel-Dekker 2005.
Deviations from the Beer-Lambert Law • Deviations caused by use of polychromatic light on a spectrum in which e changes a lot over the bandwidth of the light. • Consider two wavelengths a and b with a and b = 1000, 1000 = 1500, 500 = 1750, 250 Absorbance (A) Concentration (M)
Atomic Emission • Two types of emission spectra: • Continuum • Line spectra • Examples: • ICP-OES (inductively-coupled plasma optical emission spectroscopy), also known as ICP-AES (atomic emission spectroscopy) • LIBS (laser-induced breakdown spectroscopy)
The Emission Process • Atoms/molecules are driven to excited states (in this case electronic states), which can relax by emission of radiation. M + heat M* Higher energy E = hn Lower energy • Other process can happen instead of emission, such as “non-radiative” relaxation (e.g. transfer of energy by random collisions). M* M + heat
Atomization: The Dividing Line for Atomic and Molecular Optical Electronic Spectroscopy • Samples used in optical atomic (elemental) spectroscopy are usually atomized • This destroys molecules (if present) and leaves just atoms and atomic ions • The UV-visible spectrum of the atoms is of interest, not the molecular spectrum.
Atomic Electronic Energy Levels • Electronic energy level transitions in hydrogen – the simplest of all! • Balmer series (visible) • Transitions start (absorption) or end (emission) with the first excited state of hydrogen • Lyman series (UV) • Transitions start (absorption) or end (emission) with the ground state of hydrogen Diagrams from http://csep10.phys.utk.edu/astr162/lect/light/absorption.html
Atomic Electronic Energy Levels • Term symbols and electronic states: used to precisely define the state of electrons spin multiplicity s = total spin quantum number j = total angular momentum quantum number l = orbital quantum number (s,p,d,f…) mj= state Term: 2P s,p,d,f,g (l value) Level: 2P3/2 2j+1 State: 2P3/2-1/2 • Used to denote energy levels, and label Grotrian (or term) diagrams for the hydrogen atom Figure from the Sapphire Electronic Spectroscopy Software Package, Cavendish Instruments Limited.
Energy Levels for Different Atoms • Atomic absorption and emission are generally selective and specific for different elements on the periodic table, allowing for qualitative identification of elements Diagrams from http://csep10.phys.utk.edu/astr162/lect/light/absorption.html
Atomic Electronic Energy Levels • Term (Grotrian) diagram for the sodium atom: each transition on the diagram can be linked to a peak in the UV-visible spectrum • The number of lines can approach 5000 for transition-metal elements. • Line broadening can be caused by: • Doppler effects • pressure broadening (collisions) • Lifetime of state (uncertainty) Figure from H. A. Strobel and W. R Heineman, Chemical Instrumentation: A Systematic Approach, Wiley, 1989.
The Simulated UV-Visible Spectrum of Na0 From http://www.nist.gov/pml/data/asd.cfm
Intensity of Atomic Electronic Energy Levels • The population of energy levels partly determines the intensity of an emission peak • The Boltzmann distribution relates the energy difference between the levels, temperature, and population: E = energy of state P = number of states having equal energy at each level N = number of atoms in state • Key point: to get more atoms into excited states, you need higher temperatures. (Values from Cazes pg 79, Table 1)
Basic Instrument Design for Atomic UV-Visible Spectrometers • Atomic absorption: Radiation Source (Selective spectral lines) Sample (in torch) Wavelength Selector (can be before sample) Detector (photoelectric transducer) • Atomic emission Source (sample in torch) Wavelength Selector Detector (photoelectric transducer) • Wavelength selector is a mono- or polychromator
Sources for Atomic Emission • History: Emission came first (study of sunlight by Fraunhofer in 1817, identification of spectral “lines”), studied throughout the 1800’s and early 1900’s • Before the use of the plasma for OES in 1964, the flame/gas torch (or arc/spark, etc…) had the following problems: • Temperature instability • Not hot enough to excite/decompose all materials • Today: The plasma has become the almost universally-preferred method • History: atomic emission placed demands on monochromators • Today: Technology has led to polychromators/detectors with sufficient resolution
Plasma Torch Sources • Plasma: a low-density gas containing ions and electrons, controlled by EM forces
Plasma Torch Sources • In the inductively-coupled plasma (ICP) torch, the sample will reside for several milliseconds at 4000-8000K. • Other designs: direct current plasma, microwave induced plasma • An argon ICP torch in action: Photo by Steve Kvech, http://www.cee.vt.edu/program_areas/environmental/teach/smprimer/icpms/icpms.htm#Argon%20Plasma/Sample%20Ionization
More on Plasma Torches • Another view of an argon ICP torch: Diagram from Lagalante, Appl. Spect. Reviews. 34, 191 (1999)
Arc and Spark Sources for Atomic Emission • Arc and spark sources – used for qualitative analysis of organic and geological samples • Only semi-quantitative because of source instability • Spark sources achieve higher energies • Several mg of solid sample is packed between electrodes, 1-30 A of current is passed achieving several hundred volts potential. • Applications include metals analysis or cases where solids must be analyzed.
Designs for Monochromators and Polychromators Paschen-Runge design, shown as a polychromator Czerny-Turner design, shown as a monochromator • Polychromators • High sample throughput rate • Spectral interference can be an issue if the interfering spectral line is not included on the detector array • Monochromators • Flexibility to access any wavelength within the dimensions of the monochromator • Good for applications requiring complex background corrections • Less sensitive – lower radiation throughput (because light blocked by slits)
Atomic Emission: Diffraction Gratings • Diffraction gratings are used to select wavelengths (in combination with collimating lens, and slits) • Echelle (ladder) gratings: high dispersion and high resolution (a two-step system with a cross-disperser standard grating or prism) • ~1000-1500 grooves/mm typical for UV-Vis work • Require filters to isolate “orders” (i.e. n=1) Figure from T. Wang, in J. Cazes, ed, “Ewing’s Analytical Instrumentation Handbook”
Atomic Emission: Detectors • At the end of the spectrometer, photons are detected. • Commonly used detectors: • Photomultiplier tubes (PMT) – dynamic range 109 • Solid-state detectors: • Charge-coupled devices (CCD) – 1D or 2D arrays (charge readout or “transfer” devices) • Silicon photodiodes with thousands of individual addressable elements • These detectors are very sensitive, very well-suited to 2D echelle grating polychromators, very fast
Example Detector: Photomultiplier Tubes • A PMT is a vacuum tube that contains a photosensitive material, called the photocathode • The photocathode ejects electrons when it is struck by light. These ejected electrons are accelerated towards a dynode which ejects two to five secondary electrons for every electron that strikes its surface. • The secondary electrons strike another dynode, ejecting more electrons which strike yet another dynode, and so on (electron multiplication). • The electrical current measured at the anode is then used as a relative measure of the intensity of the radiation reaching the PMT.
Modern ICP-OES Spectrometers • Example system: • Varian Vista PRO • Features: 1. Axial flame view 2. Echelle grating polychromator (note the design is like a Czerny-Turner monochromator) 3. CCD detector • CCD chips are made of sub-arrays matched to emission lines. Figure from Varian Vista PRO sales literature.
Detection Limits of ICP-OES • Typical detection limits (for a Varian Vista MPX) • Considerations include the number of emission lines, spectral overlap • Linearity can span several orders of magnitude.
Atomic Absorption Spectroscopy (AAS) • In the beginning – atomic emission was the only way to do elemental analysis via optical spectroscopy • Bunsen and Kirchhoff (1861) – invented a non-luminous flame to study emission. Showed that alkali elements in the flame removed lines from a continuous source. • Walsh (1955) – notices that molecular spectra are often obtained in absorption (e.g. UV-Vis and IR), but atomic spectra are always obtained in emission. Proposes to use atomic absorption (AA or AAS) for elemental analysis • Advantages over emission – far less interference, avoids problems with flame temperature
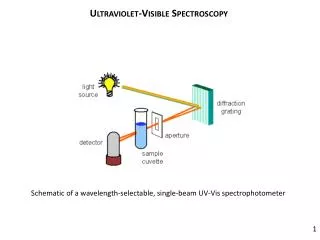
Atomic Absorption Spectroscopy: Instruments • Atomic absorption spectrometry is one of the most widely used methods for elemental analysis. • Basic principles of AA: • The sample is atomized via: • A flame (methane/H2/acetylene and air/oxygen) • An electrothermal atomizer (an electrically-heated graphite tube or cup) • UV-Visible light is projected through the flame • The atoms absorb light (electronic excitation), reducing the beam • The difference in intensity is measured by the spectrometer Source P0 Sample/Flame P Monochromator Detector Images are of Aurora AI1200, http://www.spectronic.co.uk
Atomic Absorption: Sources • Hollow cathode lamps – sputtering of an element of interest, generating a line emission spectrum: • Typical linewidths of 0.002 nm (0.02Å) • Single and multi-element lamps are available • Other AA Sources: electrode-less discharge lamp (EDL) – see Skoog Ch 9B-1
Atomic Absorption: Monochromators • The monochromator filters out undesired light in AA (typical bandwidths are 1 angstrom/0.1 nm) • This differs from ICP-OES, where the monochromator actually analyzes the frequency. • In other words – there is no need to scan the grating, just set (aimed through a slit) and run • Echelle (ladder) gratings (combined with a cross-disperser) are popular: Figure from T. Wang, in J. Cazes, ed, “Ewing’s Analytical Instrumentation Handbook”
Other Features of Atomic Absorption Systems • Sample nebulizers: Produces aerosols of samples to introduce into the flame (oxyacetylene is the hottest) • Detectors: Common examples are photomultiplier tubes, CCD (charge-coupled devices), and many more. • Monochromator: removes emissions from the flame (flame is often kept cool just to avoid emission) • Modulated source (chopper): also removes the remaining emissions from the flame. The signal of interest is given an AC modulation and passed through a high-pass filter. • Spectral interferences: • Absorption from other things (besides the element of interest) – other flame components, particulates, etc… Scattering can cause similar problems • Background correction can help
Graphite Furnace and Hydride AAS • Graphite furnace and electrothermal AAS • Analyze solutions, solids, slurries, by placing a small amount (uL) of sample on a support for evaporation and them atomization • More efficient atomization (entire sample atomized at once) – leads to smaller sample quantity requirements or better sensitivity, but reproducibility can be an issue • Hydride generation AAS • Efficiently volatilizes hydride forming elements (As, Se, Tl, Pb, Bi, Sb, Te) by making their hydrides via pre-reaction with sodium borohydride and HCl • Inexpensive method of increasing sensitivity of an AAS to ppt levels for these elements • Mercury cold-vapor AAS (Hg only)
Detection Limits of Atomic Absorption Systems • Detection limits in ppb (µg/L) for a selection of elements • Individual results can vary depending on system, matrix, etc… Values from D. A. Skoog, et al., “Principles of Instrumental Analysis,” 5th Ed., Orlando, Harcourt Brace and Co. 1998, pg. 225.
How Are Elements Actually Analyzed? • For AA and ICP-OES, samples are dissolved or digested into solution, flowed into the flame/plasma and analyzed. • Two methods for quantitative analysis calibration: • Standard calibration: the unknown sample’s absorbance/emission is compared with several references which “bracket” the expected concentration assuming a linear relationship. • Standard addition: the unknown sample is divided into several portions. One portion is directly analyzed, the others have the reference material added in varying amounts. The linear relationship is determined, and the intercept is used to calculate the real concentration of the unknown. • Speciated analysis may be needed. The analysis of atomic “species”, elements in chemically distinguishable environments, usually by hyphenation (e.g. ICP-OES coupled to a HPLC, AA coupled to a GC) or offline extraction. • At the end: the results yield elements in ppm, ppb, mg/mL, or below LOQ or LOD
Laser-Induced Breakdown Spectroscopy (LIBS) • A focused laser can be used to create a plasma (usually a pulsed Q-switched Nd:YAG laser) • Portable systems capable of standoff analysis are now available – applications in the detection of explosives, chemical warfare agents, environmental analysis, etc… Figure from D. A. Cremers, R. C. Chinni, “Laser-induced breakdown spectroscopy - Capabilities and limitations,” Appl. Spectrosc. Rev., 2009, 44, 457-506, http://dx.doi.org/10.1080/05704920903058755.
A Typical LIBS Spectrum • The LIBS spectrum of ibuprofen drug substance • Emission lines used for C, H, O, and N analysis were 247.9, 656.3, 777.2 (triplet), and 746.8 nm, along with the molecular band of C2 at 516 nm. Figure from J. Anzano et al., “Rapid characterization of analgesic pills by laser-induced breakdown spectroscopy (LIBS),” Med. Chem. Res. 2009,18, 656–664.
Atomic Fluorescence • Developed as an alternative to AA and ICP-OES, with potentially greater sensitivity. • Has not yet achieved widespread use but cheaper tunable lasers may change this. • Laser – stimulated emission (coherent emission from an excited state induced by a second photon) • Processes that emit a fluorescent photon: Non-radiative hv Thermal hv Non-radiative hv hv Direct Line Stepwise Thermally-assisted Resonance
Atomic Fluorescence • Basic AF instrument design: Sample Wavelength Selector Detector (photoelectric transducer) Radiation source (90° angle) • AF sources include hollow-cathode lamps, electrodeless discharge tubes (brighter), and lasers (brightest) Picture of HCT lamps from Perkin-Elmer
Further Reading Required: A. F. Lagalante, “Atomic absorption spectroscopy: A tutorial review.” Appl. Spectrosc. Rev.1999, 34, 173-189. A. F. Lagalante, “Atomic emission spectroscopy: A tutorial review.” Appl. Spectrosc. Rev. 1999, 34, 191-207. Optional: J. Cazes, Ed. Ewing’s Analytical Instrumentation Handbook, 3rd Edition, 2005, Marcel Dekker, Chapters 3 and 4. D. A. Skoog, F. J. Holler and S. R. Crouch, Principles of Instrumental Analysis, 6th Edition, 2006, Brooks-Cole, Chapters 8, 9, and 10. N. Lewen, “The use of atomic spectroscopy in the pharmaceutical industry for the determination of trace elements in pharmaceuticals,” J. Pharm. Biomed. Anal.2011, 55, 653-661, http://dx.doi.org/10.1016/j.jpba.2010.11.030. H. A. Strobel and W. R. Heineman, “Chemical Instrumentation: A Systematic Approach”, 3rd Ed., Wiley (1989). D. A. Cremers, R. C. Chinni, “Laser-induced breakdown spectroscopy - Capabilities and limitations,” Appl. Spectrosc. Rev., 2009, 44, 457-506, http://dx.doi.org/10.1080/05704920903058755.