Download
1 / 66
660 likes | 927 Views
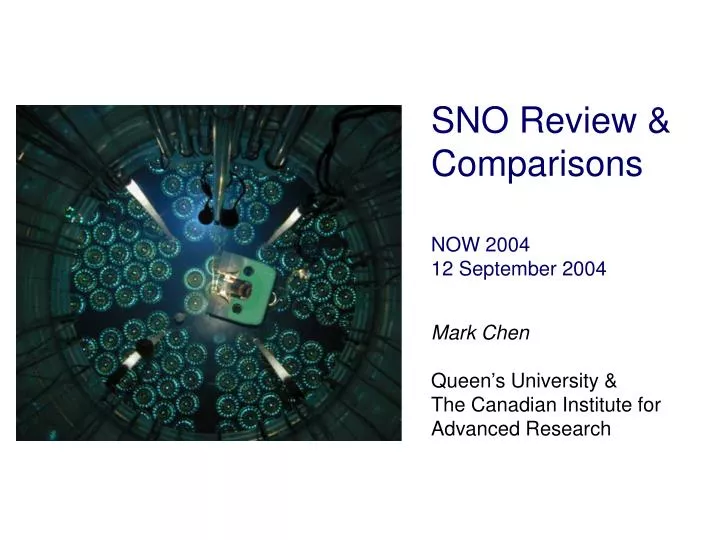
SNO Review & Comparisons NOW 2004 12 September 2004. Mark Chen Queen’s University & The Canadian Institute for Advanced Research. The SNO Collaboration. S.D. Biller, M.G. Bowler, B.T. Cleveland, G. Doucas, J.A. Dunmore, H. Fergani, K. Frame, N.A. Jelley, S. Majerus,

E N D
SNO Review & Comparisons NOW 2004 12 September 2004 Mark Chen Queen’s University & The Canadian Institute for Advanced Research
The SNO Collaboration S.D. Biller, M.G. Bowler, B.T. Cleveland, G. Doucas, J.A. Dunmore, H. Fergani, K. Frame, N.A. Jelley, S. Majerus, G. McGregor, S.J.M. Peeters, C.J. Sims, M. Thorman, H. Wan Chan Tseung, N. West, J.R. Wilson, K. Zuber Oxford University E.W. Beier, M. Dunford, W.J. Heintzelman, C.C.M. Kyba, N. McCauley, V.L. Rusu, R. Van Berg University of Pennsylvania S.N. Ahmed, M. Chen, F.A. Duncan, E.D. Earle, B.G. Fulsom, H.C. Evans, G.T. Ewan, K. Graham, A.L. Hallin, W.B. Handler, P.J. Harvey, M.S. Kos, A.V. Krumins, J.R. Leslie, R. MacLellan, H.B. Mak, J. Maneira, A.B. McDonald, B.A. Moffat, A.J. Noble, C.V. Ouellet, B.C. Robertson, P. Skensved, M. Thomas, Y.Takeuchi Queen’s University D.L. Wark Rutherford Laboratory and University of Sussex R.L. Helmer TRIUMF A.E. Anthony, J.C. Hall, J.R. Klein University of Texas at Austin T.V. Bullard, G.A. Cox, P.J. Doe, C.A. Duba, J.A. Formaggio, N. Gagnon, R. Hazama, M.A. Howe, S. McGee, K.K.S. Miknaitis, N.S. Oblath, J.L. Orrell, R.G.H. Robertson, M.W.E. Smith, L.C. Stonehill, B.L. Wall, J.F. Wilkerson University of Washington T. Kutter, C.W. Nally, S.M. Oser, C.E. Waltham University of British Columbia J. Boger, R.L. Hahn, R. Lange, M. Yeh Brookhaven National Laboratory A. Bellerive, X. Dai, F. Dalnoki-Veress, R.S. Dosanjh, D.R. Grant, C.K. Hargrove, R.J. Hemingway, I. Levine, C. Mifflin, E. Rollin, O. Simard, D. Sinclair, N. Starinsky, G. Tesic, D. Waller Carleton University P. Jagam, H. Labranche, J. Law, I.T. Lawson, B.G. Nickel, R.W. Ollerhead, J.J. Simpson University of Guelph J. Farine, F. Fleurot, E.D. Hallman, S. Luoma, M.H. Schwendener, R. Tafirout, C.J. Virtue Laurentian University Y.D. Chan, X. Chen, K.M. Heeger, K.T. Lesko, A.D. Marino, E.B. Norman, C.E. Okada, A.W.P. Poon, S.S.E. Rosendahl, R.G. Stokstad Lawrence Berkeley National Laboratory M.G. Boulay, T.J. Bowles, S.J. Brice, M.R. Dragowsky, S.R. Elliott, M.M. Fowler, A.S. Hamer, J. Heise, A. Hime, G.G. Miller, R.G. Van de Water, J.B. Wilhelmy, J.M. Wouters Los Alamos National Laboratory
Sudbury Neutrino Observatory 1000 tonnes D2O 12 m diameter Acrylic Vessel 18 m diameter support structure; 9500 PMTs (~60% photocathode coverage) 1700 tonnes inner shielding H2O 5300 tonnes outer shielding H2O Urylon liner radon seal depth: 2092 m (~6010 m.w.e.) ~70 muons/day
n + + + n NC d p n x x Neutrino Reactions in SNO n + + + CC d p p e− e • Q = 1.445 MeV • good measurement of ne energy spectrum • some directional info (1 – 1/3 cosq) • ne only • Q = 2.22 MeV • measures total 8B n flux from the Sun • equal cross section for all active n flavors + + n e− n e− ES x x • low statistics • mainly sensitive to ne, some n and n • strong directional sensitivity
SNO Neutral Current Trilogy Pure D2O Nov 99 – May 01 n d t g (Eg = 6.25 MeV) good CC PRL 87, 071301 (2001) PRL 89, 011301 (2002) PRL 89, 011302 (2002) “D2O Archival Long Paper” in progress Salt Jul 01 – Sep 03 n 35Cl 36Cl g (Eg = 8.6 MeV) enhanced NC and event isotropy PRL 92, 181301 (2004) “Long Salt Paper” soon to be submitted 3He Counters Fall 04 – Dec 06 n 3He t p proportional counters s = 5330 b event-by-event separation “First NCD Paper” in the future
x PMT n NCD SNO Phase III: 3He Detectors 3He Proportional Counters (“NC Detectors”) Detection Principle 2H + x p + n + x - 2.22 MeV (NC) 3He + n p + 3H + 0.76 MeV 40 Strings on 1-m grid 398 m total active length Physics Motivation Event-by-event separation. Measure NC and CC in separate data streams. Different systematic uncertainties than neutron capture on NaCl. 3He array removes neutrons from CC, calibrates remainder. CC spectral shape.
Structure of this Talk – Comparison of Phases • signals • backgrounds • energy and optics • flux • spectral shape • day-night analysis • oscillation analysis
Čerenkov Detection PMT Measurements • position • charge • time Reconstructed Event -event vertex -event direction -energy -isotropy
Signal Extraction Pure D2O • signal PDFs • energy • R3 (radius) • cos qSun • Monte Carlo • maximum likelihood fit with background amplitudes fixed
Signal Extraction Salt Phase statistical signal separation – extended maximum likelihood energy R3 use R3, cos qSun, b14 event isotropy cos qSun b14 perform signal extraction w/o any spectral shape assumptions
g n 36Cl* 36Cl 35Cl NaCl Neutron Detection • higher capture cross section • higher energy release • many gammas s = 44 b 35Cl+n s = 0.0005 b 8.6 MeV 2H+n 6.3 MeV 3H 36Cl
Neutron Capture Efficiency 35Cl(n,g)36Cl <e> = 0.399 ± 0.010 Te≥ 5.5 MeV and Rg ≤ 550 cm 2H(n,g)3H <e> = 0.144 ± 0.005 Te≥ 5.0 MeV and Rg ≤ 550 cm 252Cf fission neutron source 2 tonnes of NaCl added to 1000 tonnes heavy water
Simulated Neutron Event in D2O • neutron events in pure D2O look very similar to single electrons
Simulated Neutron Event in Salt • neutron events in salt are more isotropic
energy & direction Čerenkov Light and b14 hollow cone of emitted photons qij e− (v > c/n) ) 43o sum over all pairs of PMT hits b14 = b1 + 4b4
Neutron Signals from the First NCD • data taken on the J3 string (first 9.5 m long NCD) with the AmBe source on 12/02/03 at 22:38 EST • bin 135 is about 764 keV • total number of neutrons in the peak roughly matches Monte Carlo prediction
Comparison of Phases • signals • backgrounds • energy and optics • flux • spectral shape • day-night analysis • oscillation analysis
Sources of Background • g + d → p + n, from 214Bi (U chain), 208Tl (Th chain) • cosmic rays: neutrons, spallation products • atmospheric neutrinos, reactors, CNO electron capture • fission (U, Cf) • (a,n) reactions • 24Na activation (neck, calibration, recirculation, muons) • AV events • focus is on neutron backgrounds to the NC
Pure D2O Water Assays targets are set to reduce b-g events reconstructing inside 6 m targets for D2O represent a 5% background from g + d n + p
Salt Phase Water Assays • bottom of vessel • 2/3 way up • top of vessel salted D2O radioactivity should produce 0.72 ± 0.24 neutrons per day pure D2O radioactivity was estimated at 1.0 ± 0.2 neutrons per day the SSM rate of NC events would produce 13.1 neutrons per day • MnOx • HTiO • MnOx • HTiO
24Na 2.75 MeV 1.37 MeV 24Mg New Salt Phase Background • 24Na activation • neutrons activate 23NaCl…salty D2O can be activated outside the detector and brought in by circulation • + d → p + n NC background and low-energy g’s t1/2 = 14.95 hr
External 24Na Introduced Salt Injected on May 28, 2001 24Na Background The NaCl brine in the underground buffer tank was activated by neutrons from the rock wall. We observed the decay of 24Na after the brine is injected in the SNO detector. t1/2=14.95 hrs
External Neutrons • light water g’s photodisintegrate deuteron • radon daughters deposited on the acrylic vessel during construction • 210Pb has t1/2 = 22 years • feeds 210Po which alpha decays • (a,n) on 13C, 17O, 18O • neutrons originate from the AV pure D2O phase salt phase estimated from radioassays, 27 ± 8 events subtracted fit both was not considered
Fitting External Neutron Backgrounds • efficient neutron capture on Cl improved separation of internal and external background neutrons r=(R [cm]/600)3
Salt Phase Backgrounds Table +24.0 −25.5
NCD Backgrounds: Pulse Shape neutron with p-t track wire neutron with p-t track || wire 14 1.5 12 10 1.0 8 De-logged current De-logged current 0.5 6 4 0.0 2 0 -0.5 0 2 4 6 8 0 2 4 6 8 Time (microseconds) Time (microseconds) a track wire 20 15 De-logged current 10 5 0 0 1 2 3 4 5 Time (microseconds) current preamplifiers digitize pulse shapes for particle identification
Comparison of Phases • signals • backgrounds • energy and optics • flux • spectral shape • day-night analysis • oscillation analysis
Optical Calibrations • manipulator positioning accuracy: ~2 cm • laserball moved throughout detector (in two planes) • extract optical parameters (D2O attenuation, PMT angular response, H2O attenuation) at various wavelengths B. Moffat with dye laser and laserball
16N 7.13 s b− 1% 8.87 5% 7.12 68% 6.13 26% 16O 16N Calibration Source • internally triggered • used for: • energy scale • energy drift • detector radial response • energy resolution • vertex resolution • angular resolution M. Boulay with 16N source
Monitoring Detector Optics • D2O attenuation increasing • water chemistry analyses reveal increasing Mn and organics • consistent with light absorption feature at ~420 nm
Salt Energy Scale Drift energy scale drift agrees with MC prediction coming from slight increase in D2O photon absorption over time…
Desalination • started 09/09/2003 • pass #1 completed 09/14/2003…100x reduction reverse osmosis
Pass #1 Stratification salt water more dense salt probe conductivity measurement salt interface remained solid throughout operation purified D2O floats probe z position [cm]
Na and Impurities Removed feed permeate
Optics Restored – Confirmation! salt phase energy drift −1.8% per year due to D2O attenuation desalination pass #1 Mn and/or TOC light absorption removed!
example of a current NCD phase optics calibration occupancy map from laserball source in the centre of the detector working now to understand the detector (PMT’s and NCD’s) Optics Destroyed! in NCD Phase
Comparison of Phases • signals • backgrounds • energy and optics • flux • spectral shape • day-night analysis • oscillation analysis
1st paper threshold CC 1967.7 #EVENTS +61.9 +26.4 +49.5 +25.6 +60.9 +48.9 ES 263.6 NC 576.5 SNO Pure D2O Results (2002) 306.4 days +12−12 neutron background: 78 primarily g + d → p + n Čerenkov background: 45 +18−12
+0.06 −0.05 +0.09 −0.09 +0.24 −0.23 +0.12 −0.12 +0.44 −0.43 +0.46 −0.43 Ethreshold > 5 MeV Constrained Shape Fluxes *En >2.2 MeV Fcc(ne) = 1.76 (stat.) (syst.) × 106 cm−2s−1 Fes(nx) = 2.39 (stat.) (syst.) × 106 cm−2s−1 Fnc(nx) = 5.09 (stat.) (syst.) × 106 cm−2s−1 * +0.05 −0.05 +0.09 −0.09 Fe = 1.76 (stat.) (syst.) × 106 cm−2s−1 Fmt = 3.41 (stat.) (syst.) × 106 cm−2s−1 +0.45 −0.45 +0.48 −0.45 more than just ne coming from the Sun!
CC 1339.6 #EVENTS +23.9 +69.8 +63.8 NC 1344.2 -61.5 -20.1 -69.0 ES 170.3 Salt Phase 254.2 neutrino live-days Energy Spectra Radial Light Isotropy Sun-angle dist.
compare with pure D2O Fcc(ne) = 1.76 (stat.) (syst.) × 106 cm−2s−1 Fes(nx) = 2.39 (stat.) (syst.) × 106 cm−2s−1 Fnc(nx) = 5.09 (stat.) (syst.) × 106 cm−2s−1 +0.06 −0.05 +0.09 −0.09 +0.24 −0.23 +0.12 −0.12 +0.44 −0.43 +0.46 −0.43 standard (Ortiz et al.) shape of 8B spectrum in CC and ES: SNO Salt Fluxes shape of 8B spectrum in CC and ES not constrained:
Uncertainties in Fluxes (%) energy scale resolution radial accuracy angular resolution isotropy mean isotropy width radial E bias internal neutrons Čerenkov bkds “AV” events neutron capture total
Total Active 8B Fluxes in units of Bahcall, Pinsonneault, Basu 2001 SSM, 5.05 x 106 cm−2 s−1 • results are consistent with SSM and with each other • uncertainty in total flux reduced in the new salt result, even while constraints were relaxed +0.20 −0.16 new S17
Next Salt Paper: Fluxes • 254.2 days to 391.4 days, increased statistics • improved systematics determinations (does not mean all systematics have become smaller!)
NCD Phase: Fluxes • good statistics • CC, NC break correlations • smaller systematic uncertainties
Comparison of Phases • signals • backgrounds • energy and optics • flux • spectral shape • day-night analysis • oscillation analysis
Pure D2O Energy Spectrum tan2q Day Spectrum CC+NC+ES 0.9 0.8 0.7 0.6 0.5 0.4 0.3 would be worse with salt Dm2 = 8 × 10⁻⁵ eV2
Salt Extracted CC Spectral Shape tan2q CC Spectral Shape 0.9 0.8 0.7 0.6 0.5 0.4 0.3 rate/SSM recoil electron total energy [MeV] Dm2 = 8 × 10⁻⁵ eV2