Download
1 / 10
250 likes | 1.22k Views
Experiment 6 Titration curve of amino acid. Mona AL- Harbi. Introduction : Titration curve: is produced by monitoring the PH of a given volume of a sample solution after successive addition of acid or base. Amino acids are example of weak acid which contain more than one dissociate group.

E N D
Experiment 6 Titration curve of amino acid Mona AL-Harbi
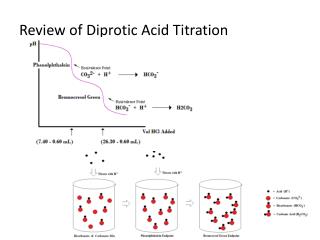
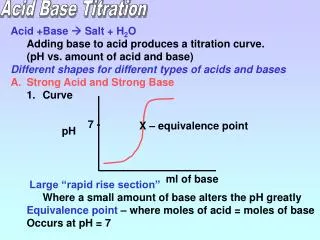
Introduction: Titration curve: is produced by monitoring the PH of a given volume of a sample solution after successive addition of acid or base. Amino acids are example of weak acid which contain more than one dissociate group. Example : alanine contain COOH (PKa1= 2.34)and NH3 (PKa2= 9.69) groups The COOH will dissociate first then NH3 dissociate later . (Because PKa1<PKa2)
9X 8X 7X 6X 5X 4X 3X 2X 1X [1] alanine in starting point is full protenation [NH3+-CH-CH3-COOH] [2] COOH will dissociate first , [NH3+-CH-CH3-COOH] > [NH3+-CH-CH3-COO-] PH<PKa1 [3] [NH3+-CH-CH3-COOH]=[NH3+-CH-CH3-COO-] , PH=PKa1, We already define Pka in the last experiment , in this point the component of alanine act as buffer
9X 8X 7X 6X 5X 4X 3X 2X 1X [4] [NH3+-CH-CH3-COOH]<[NH3+-CH-CH3-COO-] , PH > PKa1 [5] The COOH full dissociate to COO- , [NH3+-CH-CH3-COO-] . At this point the conc. Of negative charge = conc. Of positive charge .the amino acid present as Zwetter ion . PI (isoelectric point) : PH value at which the net charge of amino acid equal to zero. PI = (PKa1 + PKa2) /2 = (2.32+9.96)/2= 6.01
9X 8X 7X 6X 5X 4X 3X 2X 1X [6] the NH3+ start dissociate , [NH3+-CH-CH3-COO-] >[NH2-CH-CH3-COO-] PH <PKa2 [7] [NH3+-CH-CH3-COO-] = [NH2-CH-CH3-COO-] . PH=PKa2 , the componetnt of alanine act as buffer.
9X 8X 7X 6X 5X 4X 3X 2X 1X [8] [NH3+-CH-CH3-COO-] < [NH2-CH-CH3-COO-] , PH >PKa2 [9] the NH3 group will dissociate and at the same time the alanine full dissociate in end point , [NH2-CH-CH3-COO] POH= (Pkb+P[A-])/2 PKb = PKw – PKa2
Note: The PH calculated by different way : [1] at starting point PH= (Pka+P[HA])/2 [2] At any point within the curve (after , in or after middle titration) PH=Pka+logA-/HA [3] At end point POH=(PKb+P[A-])/2 PH=PKw – POH
Objective: To study titration curve , determine Pka1 , Pka2 and PI values of amino acids and reinforce the understanding of buffer. Method: (A) You are provided with 10 ml of a 0.1M alanine solution, titrate it with 0.2M NaOH adding the base drop wise mixing, and recording the pH after each 0.5 ml NaOH added until you reach a pH=13.
Method: (B) You are provided with 10 ml of a 0.1M alanine solution, titrate it with 0.2M HCL adding the aciddrop wise mixing, and recording the pH after each 0.5 ml HCL added until you reach a pH=1.3
Result: • [1] record the titration table and Plot a Curve of pH versus ml of NaOH and HCL added. • [2]Calculate the pH of the alanine solution after the addition of 0 ml, 5ml, of 0.2M NaOH. And calculate PH after addition of 2 ml , 8 ml of HCL • [3] determine the Pka1 and PKa2 values of alanine • [4]Compare your calculated pH values with those obtained from Curve. • [5] determine the PI value from your result (From your curve).