Download
1 / 28
290 likes | 523 Views
Chapter 4 Atmospheric Pressure and Wind. The atmosphere contains a tremendous number of gas molecules being pulled toward Earth by the force of gravity. These molecules exert a force on all surfaces with which they are in contact, and the amount of that force exerted

E N D
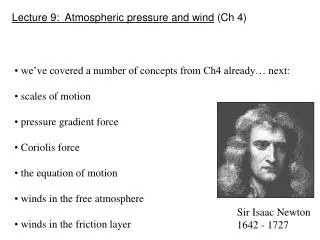
Chapter 4 Atmospheric Pressure and Wind
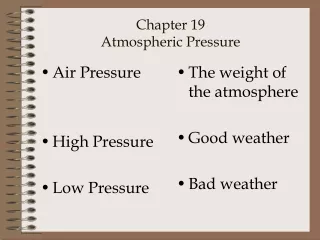
The atmosphere contains a tremendous number of gas molecules being pulled toward Earth by the force of gravity. These molecules exert a force on all surfaces with which they are in contact, and the amount of that force exerted per unit of surface area is pressure.
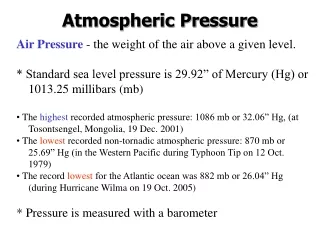
The standard unit of pressure is the pascal (Pa). Meteorologists in the U.S. use the millibar (mb), which equals 100 Pa. Canadian meteorologists use the kilopascal (kPa), equal to 1000 Pa, or 10 mb. Air pressure at sea level is roughly 1000 mb (100 kPa) or more precisely, 1013.2 mb.
The enclosed air molecules move about continually and exert a pressure on the interior walls of the container (a). Pressure can increase by increasing the density of the molecules (b) or increasing the temperature (c). If the air in the container is a mixture of gases, each gas exerts its own specific amount of pressure, referred to as its partial pressure. The total pressure exerted is equal to the sum of the partial pressures. This relationship is known as Dalton’s law.
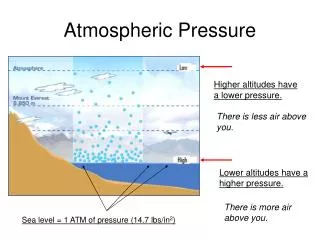
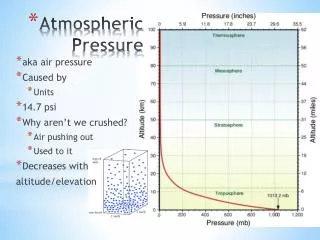
Surface pressure is the pressure actually observed at a particular location, whereas sea level pressure is the pressure that would exist if the observation point were at sea level. Sea level pressure allows us to compare pressure at different locations taking into account differences in elevation. To correct for elevation, add 1 mb per 10 meters. For high-elevation sites, this method is unreliable because we must account for compressibility of the atmosphere.
Pressure does not decrease at a constant rate. It decreases most rapidly at low elevations and at greater heights. Pressure decreases with altitude by about half for each 5.5 km.
The Equation of State (Ideal Gas Law) p = ρRT where pis pressure expressed in pascals, ρ(rho)is density in kilograms, R is a constant equal to 287 joules per kilogram per kelvin, Tis temperature in kelvins. The equation tells us if the air density increases while temperature is held constant, the pressure will increase, and at constant density, an increase in temperature leads to an increase in pressure.
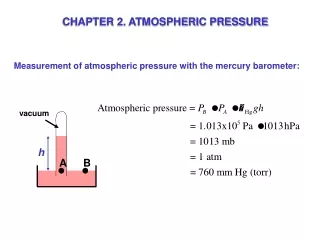
The standard instrument for the measurement of pressure is the mercury barometer invented by Evangelista Torricelli in 1643. Barometric pressure is often expressed as the height of the column of mercury in a barometer, which at sea level averages 76 cm (29.92 in). To convert barometric heights to millibars: 1 cm = 13.32 mb 1 inch = 33.865 mb
An alternative instrument for the observation of pressure is the aneroid (“without liquid”) barometer which contains a collapsible chamber from which some of the air has been removed. The weight of the atmosphere presses on the chamber and compresses it by an amount proportional to the air pressure. Aneroid devices that plot continuous values of pressure over extended periods are called barographs.
An isobar is a line that connects points having exactly the same sea level pressure drawn at intervals of 4 mb on surface weather maps. The spacing of the isobars indicates the strength of the pressure gradient, or rate of change in pressure. A dense clustering of isobars indicates a steep pressure gradient (a rapid change in pressure with distance), while widely spaced isobars indicate a weak gradient.
A weather map showing the distribution of sea level air pressure. The pressure is relatively low over the northeastern U.S. and eastern Canada, and the highest and lowest pressure on the map are only within about 4 percent of each other.
If the air over one region exerts a greater pressure than the air over an adjacent area, the higher-pressure air will spread out toward the zone of lower pressure as wind. The pressure gradient gives rise to the pressure gradient force, which sets the air in motion. For pressure gradients measured at constant altitude, we use the term horizontal pressure gradient force. Everything else being equal, the greater the pressure gradient force, the greater the wind speed.
The vertical pressure gradient force and the force of gravity are normally of nearly equal value and operate in opposite directions, a situation called hydrostatic equilibrium. The Hydrostatic Equation Δp Δz = -ρ g where Δprefers to a change in pressure, Δzrefers to a change in altitude, and -ρ grefers to density and the acceleration of gravity.
Two columns of air with equal temperatures, pressures, and densities (a). Heating the column on the right (b) causes it to expand upward. It still contains the same amount of mass, but it has a lower density to compensate for its greater height. Because the pressure difference between the base and top is still 500 mb, the vertical pressure gradient is smaller.
The gradual poleward decrease in mean temperature results in denser air occurring at high latitudes. As indicated by the hydrostatic equation, pressure drops more rapidly with height at high latitudes and lowers the height of the 500 mb level. The dashed lines depict the height of the 500 mb level as they would be drawn on a 500 mb weather map.
A 500 mb map with height contours labeled in decameters ranging from 5880 m in the south to 5220 m in the extreme northwest. Contours for 500 mb maps are drawn at 60 m intervals. These maps depict the varying heights of pressure levels. Where height contours are close, the pressure gradient force is large.
The rotation of Earth gives rise to the Coriolis force which causes an apparent deflection (turning) of the wind to the right in the Northern Hemisphere and to the left in the Southern Hemisphere. The Coriolis force is zero at the equator and increases to a maximum at the poles. The Coriolis force acting on any moving object increases with the object’s speed. However, the force changes only the direction of a moving object, never its speed.
The other factor that influences the movement of air is friction. Air in contact with the surface experiences frictional drag, which decreases wind speed. Friction is important within the lowest 1.5 km of the atmosphere (planetary boundary layer). Air in the free atmosphere, above 1.5 km, experiences negligible friction.
The Equation of Motion Δv / Δt = Fp + Fc + Ff where Fpstands for pressure gradient, Fcstands for the Coriolis effect, and Ffstands for friction. The equation of motion says the acceleration of a mass of air is the sum of the accelerations of these three forces.
A stationary parcel of air in the upper atmosphere subjected to a south-to- north pressure gradient force (a). If the parcel is tethered to an imaginary pole, no movement of the parcel can take place. Once the imaginary cord is cut, the horizontal pressure gradient accelerates the parcel northward (b). Initially, when the wind speed is low, the Coriolis force is small. As the parcel speeds up, the strength of the Coriolis force increases and causes greater displacement to the right (c). The wind speed increases the Coriolis force sufficiently to cause the air to flow perpendicular to the pressure gradient force. The air flow becomes unaccelerated, with unchanging speed and direction known as geostrophic flow (or geostrophic wind).
In common pressure distributions the height contours curve and assume varying distances from one another. In the absence of friction, the air flows parallel to the contours constantly changing direction and therefore undergoing an acceleration. In order for the air to follow the contours, there must be a continual mismatch between the pressure gradient and Coriolis forces. This movement is known as gradient flow (or gradient wind).
Supergeostropic flow (a) occurs in the upper atmosphere around high-pressure systems. As the air flows, it is constantly turning to its right. This turning motion occurs because the Coriolis force has a greater magnitude than the pressure gradient force (as represented by the length of the dashed arrows). Observe the changing direction of the four solid arrows 1 through 4. Subgeostrophic flow (b) occurs in the upper atmosphere around low-pressure systems. The pressure gradient force is greater than the Coriolis force and the air turns to its left in the Northern Hemisphere.
Geostrophic flow cannot exist near the surface. Friction slows the wind, so that the Coriolis force is less than the pressure gradient force. The air flows at an angle to the right of the pressure gradient force in the Northern Hemisphere (a) and to the left in the Southern Hemisphere (b).
Enclosed areas of high pressure marked by roughly circular isobars or height contours are called anticyclones. The wind rotates clockwise around anticyclones in the Northern Hemisphere, as the Coriolis force deflects the air to the right and the pressure gradient force directs it outward. In the boundary layer, the air spirals out of anticyclones (a), while in the upper atmosphere it flows parallel to the height contours (b). In the Southern Hemisphere, the flow is counterclockwise (c) and (d).
Closed low-pressure systems are called cyclones. Air spirals counterclockwise into surface cyclones in the Northern Hemisphere (a) and rotates counterclockwise around an upper-level low (b). The flow is reversed in the Southern Hemisphere (c) and (d).
Elongated zones of high and low pressure are called ridges (a) and troughs (b), respectively.
Direction is always given as that from which the wind blows, so that a “westerly” wind is one from the west. It is often expressed by its azimuth, the degree of angle from due north, moving clockwise. A simple device for observing wind direction is the wind vane. Wind speeds are measured with anemometers that have rotating cups mounted on a moving shaft. Looking like an airplane without wings (right), an aerovane indicates both wind direction and speed.
The next chapter examines atmospheric moisture.