Download
1 / 47
470 likes | 602 Views
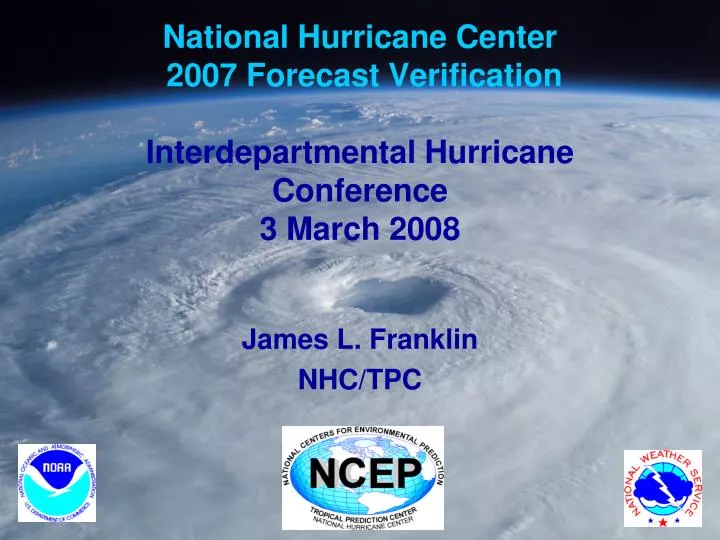
National Hurricane Center 2007 Forecast Verification Interdepartmental Hurricane Conference 3 March 2008. James L. Franklin NHC/TPC. Summary: Atlantic Track.

E N D
National Hurricane Center 2007 Forecast VerificationInterdepartmental Hurricane Conference3 March 2008 James L. Franklin NHC/TPC
Summary: Atlantic Track • OFCL track errors set records for accuracy from 36-96 h. Errors continue their downward trends, although skill has been flat for several years. • OFCL track forecasts beat consensus models at some time periods, but trailed the best of the dynamical models (an atypical result). • GFS and UKMET provided best dynamical track guidance. GFDL and NGPS had relatively poor years. ECMWF was mediocre. • A respectable first season for the HWRF, but it isn’t ready to replace the GFDL. A combination of the two is better than either alone.
Summary: Atlantic Intensity • Very difficult year (as measured by Decay-SHIFOR), and OFCL errors were up considerably compared to 2006. OFCL in 2007 was more skillful, however, than in 2006. • Best models were statistical, as has almost always been the case. Four-model consensus (DSHP/LGEM/HWRF/GHMI) seems promising.
Summary: East Pacific Track • OFCL track errors set records at 12-36 h. • OFCL beat individual dynamical models but not the consensus (the typical result). • There continues to be a much larger difference between the dynamical models and the consensus in the eastern North Pacific than there is in the Atlantic, which is suggestive of different error mechanisms in the two basins.
Summary: East Pacific Intensity • OFCL added considerable value over the guidance through 48 h, but lagged the guidance thereafter. • Best guidance was statistical. LGEM did very well, as did the 4-model consensus.
Slide Courtesy of Eric Blake (NHC) NOAA’s 2007 Atlantic Hurricane Outlook Season and May 2007 Aug 2007 Observed Activity Type Outlook Outlook Activity Climatology Chance Above Normal 75% 85% 33% Chance Near Normal 20% 10% Near Normal 33% Chance Below Normal 5% 5% 33% Named Storms 13-17 13-16 15 11 Hurricanes 7-10 7-9 6 6 Major Hurricanes 3-5 3-5 2 2 ACE % of Median 125-210 140-200 84 ~100
Graphic Courtesy of Gerry Bell (CPC) NOAA’s Atlantic Hurricane Outlooks (ACE) Last 6 forecasts have been outside the predicted range. The Hurricane Specialists have been very concerned about the effect that the seasonal forecasts, and the media hype that surrounds them, have on the hurricane warning program, and are glad to see that NOAA will be looking at ways to minimize these problems.
Verification Rules • Verification rules unchanged for 2007. Results presented here are final. • System must be a tropical or subtropical cyclone at both forecast initial time and verification time. All verifications include depression stage except for GPRA goal verification. • Special advisories ignored (original advisory is verified. • Skill baselines are recomputed after the season from operational compute data. Decay-SHIFOR5 is the intensity skill benchmark.
2007 Atlantic Verification VT NT TRACK INT (h) (n mi) (kt) ============================ 000 208 7.9 2.1 012 177 32.8 8.1 024 145 51.2 11.0 036 116 70.7 14.0 048 93 91.9 17.9 072 62 146.0 23.5 096 39 167.2 28.6 120 23 258.4 30.0 Values in green meet or exceed all-time records. * 48 h track error for TS and H only was 86.2 n mi, a record.
Atlantic Track Errors by Storm Fewer than half the storms had any 72-h forecasts, only Dean and Noel had any 5-day forecasts.
Atlantic Track Errors vs. 5-Year Mean Official forecast was lower than the 5-year mean, but so was CLP5 (statistics dominated by Dean, a “west-runner”).
Atlantic Track Error Trends Errors have been cut in half since 1990. Sharpest recent declines in 2003-4.
Atlantic Track Skill Trends Skill has increased since the 1990’s, in particular at the end of the decade, but has been relatively flat for the past few years.
Atlantic 5-Year Mean Track Errors Track errors increase by about 55 n mi per day. Intensity errors level off because intensity is a much more bounded problem.
OFCL Error Distributions and Cone Radii Last year’s 4- and 5-day cones were 252 and 326 n mi, respectively.
2007 Track Guidance Official forecast beat consensus models at some time periods. Best models were GFS and UKMET (especially using subjective tracker - EGRI). UKMET was last in 2006! GFDL/NOGAPS had rough years, so much so that they were a drag on the consensus. GFNI, AEMI, FSSE excluded due to insufficient availability (less than 67% of the time at 48 or 120 h).
GFDL-HWRF Comparison Good first year for the HWRF; competitive for intensity, better than GFDL for track (mainly Dean). Consensus of the two better than either alone.
Guidance Trends UKMET goes from worst to first. NOGAPS has 5th poor season in a row (and 9th out of the last 10, at least at 48 h). Even so, it contributes positively to the consensus.
Guidance Trends Relative performance at 120 h is more variable, although GFSI has been strong every year except 2005. NGPI is better at the longer periods, GFDL less so.
Consensus Models Use of EGRI (subjective tracker) improves the GUNA consensus (GENA). Mixed bag for FSSE, which appeared to lag behind at longer forecast intervals.
Consensus Models Second year in a row AEMI trailed the control run. Multi-model ensembles remain far more effective for TC forecasting. ECMWF ensemble mean is also not as good as the control run.
Goerss Corrected Consensus Continues to be of benefit, or at least no harm.
Forecaster Consensus Forecasters appear to have been successful in selecting their own consensus (in the Atlantic).
Atlantic Intensity Errors vs. 5-Year Mean In contrast to 2006, 2007 had storms that were difficult to forecast, as measured by D-SHIFOR (Dean and Felix, presumably), and OFCL suffered as a result, with errors significantly above the 5-year mean.
Atlantic Intensity Error Trends No progress with intensity.
Atlantic Intensity Skill Trends Skill returns to previous levels, with little net change over the past several years.
2007 Intensity Guidance OFCL beat the available guidance through 72 h. Statistical models back in their accustomed position, ahead of dynamical models. With the advent of the LGEM and HWRF, we now can form a 4-member intensity consensus…
2007 Intensity Guidance …which is at least as good as the best individual model at all time periods except 120 h.
2007 Intensity Guidance FSU Superensemble trailed the simple intensity consensus.
2007 East Pacific Verification VT NT TRACK INT (h) (n mi) (kt) ============================ 000 223 10.2 1.2 012 208 30.0 5.1 024 182 50.2 8.2 036 156 71.4 11.6 048 140 92.5 14.4 072 108 117.2 18.1 096 77 146.9 20.8 120 52 186.3 17.0 Values in green tied or exceeded all-time lows.
2007 vs 5-Year Mean CLIPER errors in 2007 were above their previous 5-yr means. Despite this, OFCL errors were below their previous 5-yr means.
EPAC Track Error Trends Since 1990, track errors have decreased by about 1/3.
EPAC Track Skill Trends Skill continues to improve.
2007 Track Guidance Official forecast beat the CONU consensus at some time periods; beat each individual model. EMXI best by wide margin (largely due to Kiko). UKMI, EGRI, AEMI, FSSE, GUNA excluded due to insufficient availability.
GFDL-HWRF Comparison Overall, HWRF performance not as good as the GFDL, especially at longer periods. Consensus did add value for intensity through 72 h.
Consensus Models No standouts. Substitution of EGRI for UKMI improves GUNA.
Goerss Corrected Consensus Did not help in 2007.
Forecaster Consensus Unlike the Atlantic, forecaster’s selective consensus didn’t work in the eastern Pacific. Suggests that error mechanisms in the eastern Pacific are more subtle than the Atlantic, making erroneous outliers harder to detect.
Eastern North Pacific Intensity Errors vs. 5-year Mean OFCL errors were lower than 5-yr means, but so were the Decay-SHIFOR errors.
EPAC Intensity Error Trends ♫ Same as it ever was…same as it ever was… ♫
EPAC Intensity Skill Trends Skill does seem to be inching upward…
2007 Intensity Guidance OFCL added significant value over the guidance through 48 h. Wind biases turn sharply negative at 96-120 h. LGEM provided most skillful guidance overall. HWRF had trouble, presumably with decay over cooler waters?
2007 Intensity Guidance Good value in multi-model consensus.
Consensus Changes for 2008 • Fixed consensus models (require all present) • TCON: AVNI EGRI NGPI GHMI HWFI • ICON: DSHP LGEM GHMI HWFI • Variable consensus models (require 2 present) • TVCN: AVNI EGRI NGPI GHMI HWFI GFNI EMXI • IVCN: DSHP LGEM GHMI HWFI GFNI • Corrected versions of TCON and TVCN will be TCCN and TVCC, respectively. • Substitute EGRI for UKMI in GUNA. • Discontinue CONU (it's superseded by TVCN), CCON (superseded by TVCC), GUNS, GENA (superseded by GUNA), CONE, and INT4.
Genesis Forecast Verification Good correlation between forecast and verifying genesis rates in the Atlantic with only a weak over-forecast bias. Poor correlation (except at the extremes), with a large under-forecast bias.
Genesis Verification by Bins NHC will issue experimental public quantitative/categorical genesis forecasts in 2008 in association with the Graphical Tropical Weather Outlook.