Download
1 / 2
20 likes | 181 Views
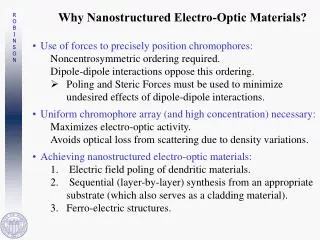
Minimum Grain Size in Nanostructured Materials Produced by Cryomilling NSF Grant MET DMR-0304629 Farghalli A. Mohamed and Yuwei Xun University of California, Irvine. Fig. 2. Fig. 1. Fig. 3.

E N D
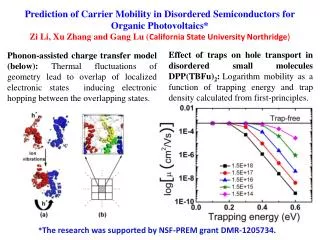
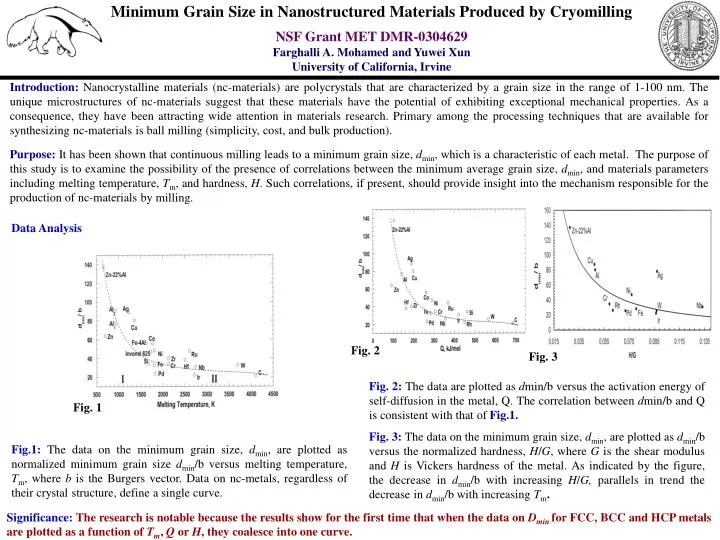
Minimum Grain Size in Nanostructured Materials Produced by Cryomilling NSF Grant MET DMR-0304629 Farghalli A. Mohamed and YuweiXun University of California, Irvine Fig. 2 Fig. 1 Fig. 3 Introduction: Nanocrystalline materials (nc-materials) are polycrystals that are characterized by a grain size in the range of 1-100 nm. The unique microstructures of nc-materials suggest that these materials have the potential of exhibiting exceptional mechanical properties. As a consequence, they have been attracting wide attention in materials research. Primary among the processing techniques that are available for synthesizing nc-materials is ball milling (simplicity, cost, and bulk production). Purpose: It has been shown that continuous milling leads to a minimum grain size, dmin, which is a characteristic of each metal. The purpose of this study is to examine the possibility of the presence of correlations between the minimum average grain size, dmin, and materials parameters including melting temperature, Tm, and hardness, H. Such correlations, if present, should provide insight into the mechanism responsible for the production of nc-materials by milling. Data Analysis Fig. 2: The data are plotted as dmin/b versus the activation energy of self-diffusion in the metal, Q. The correlation between dmin/band Q is consistent with that of Fig.1. Fig. 3: The data on the minimum grain size, dmin, are plotted as dmin/b versus the normalized hardness, H/G, where G is the shear modulus and H is Vickers hardness of the metal. As indicated by the figure, the decrease in dmin/bwith increasingH/G, parallels in trend the decrease in dmin/bwith increasing Tm. Fig.1: The data on the minimum grain size, dmin, are plotted as normalized minimum grain size dmin/b versus melting temperature, Tm, where b is the Burgers vector. Data on nc-metals, regardless of their crystal structure, define a single curve. Significance: The research is notable because the results show for the first time that when the data on Dmin for FCC, BCC and HCP metals are plotted as a function of Tm, Q or H, they coalesce into one curve.
Fig. 2 Fig. 3 Fig. 1 Minimum Grain Size in Nanostructured Materials Produced by Cryomilling NSF Grant MET DMR-0304629 Farghalli A. Mohamed University of California, Irvine Primary among the processing techniques that are available for synthesizing nc-materials (grain size < 100 nm) is ball milling. It has been shown that continuous milling leads to a minimum grain size, dmin, which is a characteristic of each metal. The purpose of this study is to develop a model that predicts the dependence of dmin, on materials parameters. The concept used in developing the model is the presence of a balance between the hardening rate introduced by dislocation generation and the recovery rate arising from dislocation annihilation and recombination. Dislocation Model Correlation Between Model Predictions and Expt. Observations The rate of grain size decrease(dt)-: Assumed to be related to the deformation energy provided by milling. This energy is a measure of plastic deformation via dislocation multiplication and motion. The rate of grain size increases, (dt)+: Assumed to be proportional to the rate of recovery resulting from dislocations annihilation and recombination to form sub boundaries or low angle boundaries (Fig. 1). Minimum grain size, dmin:dmin is obtained when (dt)+= (dt). Rate Eq.:dmin/b = A(e-Q/4RT)(DpoGb2/0kT)0.25( /Gb)0.5(G/H)1.25 where A is a dimensionless constant, b is Burgers vector, G is the shear modulus,Q is the activation energy for the recovery process, is the stacking fault energy, H is Vickers hardness, T is the absolute temperature, Dpo is the frequency term for pipe diffusion, R is the gas constant, k is Boltzmann's constant, 0 is a constant. Fig. 2: Expt. data for FCC and BCC metals are plotted as dmin/b versus the normalized hardness, H/G. As indicated by the figure, the data can be fitted to a straight line with a slope of about 1.3 (predicted 1.25). Fig. 3: Expt. values of dmin are plotted as normalized minimum grain size dmin/b versus the activation energy for recovery, QR. The data fall very close to a straight line. According to the analysis in the model, QR scales with melting temperature, Tm, and self diffusion activation energy, Q. The research is significant since a model that provides correlation between dmin and materials parameters such as hardness and stacking fault energy has been developed for the first time. Fig. 1: As milling continues, groups of dislocations approach sub boundaries where they pile-up and enter the walls.