Download

1 / 93
950 likes | 1.13k Views
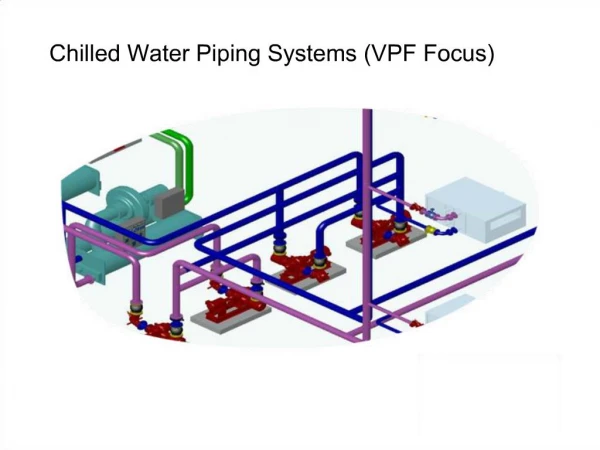
The Cost of Using 1970’s Era Design Concepts and “FEAR”in Chilled Water Systems. Presented By : Hemant Mehta, P.E. WM Group Engineers, P.C. What is the “FEAR”. No change in design as previous design had no complains from client No complain because no bench mark exists

E N D
The Cost of Using 1970’s Era Design Concepts and “FEAR”in Chilled Water Systems Presented By: Hemant Mehta, P.E. WMGroup Engineers, P.C.
What is the “FEAR” • No change in design as previous design had no complains from client • No complain because no bench mark exists • Fear to take the first step to change the concepts to use state of the art technology • Consultants sell time. Fear is any new concept will take lots of time and it is not worth the effort
What are1970’s EraDesign Concepts? • System Design for Peak load only • Primary/Secondary/Tertiary Pumping • 5°C (42°F) supply temperature • System Balancing • Circuit Setters • Band Aid solution for any Problem • Projected Demand way above reality • Oversized chiller, pumps TDH and everything else to cover behind
State of the Art Plant concepts • Plant designed for optimum operation for the year. Peak hours are less than 200 hours a year • Variable flow primary pumping system • 3.3°C (38°F) or lower supply temperature • No System Balancing. Balancing is for a static system. • No Delta P valves – No Circuit Setters • No Band Aid solution for any Problem • Use chilled water system diversity (0.63) to Project Cooling Demand • The total Chilled water pumping TDH even for a very large system should not be more 63 meters(than 200 feet)
Selecting Equipment to Optimize Efficiency Chiller equipment is often erroneously selected based on peak load efficiency. Peak load only occurs for a small number of hours of the year, as shown on the load duration curve below:
The Design of the Human Body Lungs(Chillers) Brain (Building End-Users) Heart (Variable Volume Primary Pump)
Basic 1970’s Era Chiller Plant Design Decoupler Line Building Loads Chiller Primary Pump Secondary Pump
Current Design Used on Many Large District Chilled Water Systems Chiller Energy Transfer Station Decoupler Line Building Loads Primary Pump Secondary Pump Building Pump
Modern Variable Volume Primary Chiller Plant Design Building Loads Chiller Variable Speed Primary Pump
Lost Chiller Capacity Due to Poor ΔT Ideal Design Conditions 150 L/sec (2,400 gpm) 150 L/sec (2,400 gpm) 13°C (55.5°F) 13°C (55.5°F) No Flow Through Decoupler 5°C (41°F) 5°C (41°F) 150 L/sec (2,400 gpm) 150 L/sec (2,400 gpm) Chiller sees a ΔT of 8°C (14.5°F) at a flow of 150 L/sec (2,400 gpm) The chiller capacity is therefore 5,000 kW (1,450 tons)
Lost Chiller Capacity Due to Poor ΔT Case 1: Mixing Through Decoupler Line 75 L/sec (1,200 gpm) 150 L/sec (2,400 gpm) 9°C (48.25°F) 13°C (55.5°F) 75 L/sec (1,200 gpm) at 5°C (41°F) 5°C (41°F) 5°C (41°F) 75 L/sec (1,200 gpm) 150 L/sec (2,400 gpm) Chiller sees a ΔT of 4°C (7.25°F) at a flow of 150 L/sec (2,400 gpm) The chiller capacity is therefore 2,500 kW (725 tons)
Lost Chiller Capacity Due to Poor ΔT Case 2: Poor Building Return Temperature 150 L/sec (2,400 gpm) 150 L/sec (2,400 gpm) 9°C (48.25°F) 9°C (48.25°F) No Flow Through Decoupler 5°C (41°F) 5°C (41°F) 150 L/sec (2,400 gpm) 150 L/sec (2,400 gpm) Chiller sees a ΔT of 4°C (7.25°F) at a flow of 150 L/sec (2,400 gpm) The chiller capacity is therefore 2,500 kW (725 tons)
Small Loss in ΔT Rapidly ReducesChiller Capacity Assuming a design ΔT of 8°C (14.4°F):
Technical Paper by Erwin Hanson(Pioneer in Chilled Water System Design) 8°C 9°C 11°C
Billing Algorithm for Buildings to Give Incentive to Owners to Improve ΔT • Adjusted Demand Cost • Adjusted Consumption Cost • Total Cost = Demand + Consumption
The Design of the Human Body Lungs(Chillers) Brain (Building End-Users) Heart (Variable Volume Primary Pump)
History of Variable Primary Flow Projects • King Saud University - Riyadh (1977) • Louisville Medical Center (1984) • Yale University(1988) • Harvard University (1990) • MIT(1993) • Amgen (2001) • New York-Presbyterian Hospital (2002) • Pennsylvania State Capitol Complex (2005) • Duke University (2006) • NYU Medical Center (2007) • Memorial Sloan-Kettering Cancer Center (2007)
King Saud University – Riyadh (1977) • 60,000 ton capacity with 30,000 tons for first phase • Six 5,000 ton Carrier DA chillers • Seven 10,000 GPM 240 TDH constant speed pumps • Major Problem: Too much head on chilled water pumps • Lesson Learned: Be realistic in predicting growth
Louisville Medical Center (1984) • Existing system (1984) • Primary/Secondary/Tertiary with 13,000 ton capacity • Current System (2007) • 120 feet TDH constant speed primary pumps with building booster pumps – 30,000 ton capacity • Changed the heads on some of the evaporator shells to change number of passes • Primary pumps are turned OFF during winter, Early Spring and Late Fall. Building booster pumps are operated to maintain flow.
Yale University (1988) • Existing system (1988) • Primary/Secondary/Tertiary with 10,500 ton capacity • Current System (2007) • 180 feet TDH VFD / Steam Turbine driven variable flow primary pumps – 25,000 ton capacity • Changed the heads on some of the evaporator shells to change number of passes
Amgen (2001) • Creation of a computerized hydraulic model of the existing chilled water plant and distribution system • Identification of bottlenecks in system flow • Evaluation of existing capacity for present and future loads • Two plants interconnected: Single plant operation for most of the year, second plant used for peaking • Annual Energy Cost Savings: $500,000
Additional Variable Primary Flow Projects • Harvard University (1990) • MIT(1993) • New York-Presbyterian Hospital (2002) • Pennsylvania State Capitol Complex (2005) • Duke University (2006) • NYU Medical Center (2007) • Memorial Sloan-Kettering Cancer Center (2007)
Duke University Background • CCWP-1 plant was built four years ago • CCWP-2 design was 90% complete (Primary/Secondary pumping) • We were retained by Duke to peer review the design • Peer review was time sensitive • Plant design for CCWP-2 was modified to Variable Primary pumping based on our recommendations
Duke CCWP-1 After • Dark blue pipe replaces old primary pumps
Duke CIEMAS Building CHW System 90% closed Triple duty valves 50% closed
Duke CIEMAS Building AHU-9 Balancing valve 50% closed
NYU Medical Center (2007) • Plant survey and hydraulic model indicated unnecessary pumps • 1,300 horsepower of pumps are being removed, including 11 pumps in two brand new chiller plants • $300,000 implementation cost • $460,000 annual energy savings
NYU Medical Center (2007) • Plant survey and hydraulic model indicated unnecessary pumps • 1,300 horsepower of pumps are being removed, including 11 pumps in two brand new chiller plants • $300,000 implementation cost • $460,000 annual energy savings 8 Pumps Removed 3 Pumps Removed 7 Pumps Removed 3 Pumps Removed
Bypass or removal of pumps Memorial Sloan-Kettering - After Bypass or removal of pump Bypass or removal of pumps
Pump Cemetery To date we have removed several hundred large pumps from our clients’ chilled water systems
Plant Capacity Analysis -Detailed System Analysis is a Necessity Modern computer software allows more complex modeling of system loads, which has proven to be very valuable to optimize performance and minimize cost. Return on investment to the client for detailed analysis is typically very high.
~ 20F T New York Presbyterian Hospital • Applied revolutionary control logic Log Data
Bristol-Myers Squibb • Biochemistry research building • 140,000 square feet • AHU-1 (applied new control logic) • 100,000CFM • AHU-2 (existing control logic remained) • 100,000 CFM
Bristol-Myers Squibb • Applied revolutionary control logic
Good Engineers Always Ask “Why?” • Why does the industry keep installing Primary/Secondary systems? • Why don’t we get the desired system ΔT? • Why does the industry allow mixing of supply and return water?
Good Engineers Always Ask “Why?” • Why does the industry keep installing Primary/Secondary systems? • Why don’t we get the desired system ΔT? • Why does the industry allow mixing of supply and return water? Answer: To keep consultants like us busy! Why change?
Reasons to Change • The technology has changed • Chiller manufacturing industry supports the concepts of Variable Primary Flow • Evaporator flow can vary over a large range • Precise controls provides high Delta T
Change is Starting Around the World • Most of the large district cooling plants in Dubai currently use Primary/Secondary pumping • By educating the client we were able to convince them that this is not necessary • We are now currently designing three 40,000 ton chiller plants in Abu Dhabi using Variable Primary Flow as part of a $6.9 billion development project
1985: $ 0.171/ton-hr 2002: $0.096/ton-hr Summary • There are many chilled water plants with significant opportunities for improvement • WM Group has a proven record of providing smart solutions that work • We will be happy to review your plant logs with no obligation
Thank You Hemant Mehta, P.E. President WMGroup Engineers, P.C. (646) 827-6400 hmehta@wmgroupeng.com
The New Royal Project Central Energy Plant Study By September 16, 2008
Project Objective • Determine the Optimum Central Energy Plant Configuration and Cogeneration Feasibility
The New Royal Project • A new tertiary hospital for the region • 95,000 m2 initial area (basis of analysis) • Disaster Recovery Consideration • N+1 • Onsite Power Generation (+/- 70% of peak demand) • Two separate central plants
Study Approach • Developing load profiles for Heating, Cooling and Power • Developing and screening of Options • Creating a computer model for energy cost estimate • Performing Lifecycle Cost Analysis • Performing Sensitivity Analysis • Conclusions