Download
1 / 1
10 likes | 173 Views
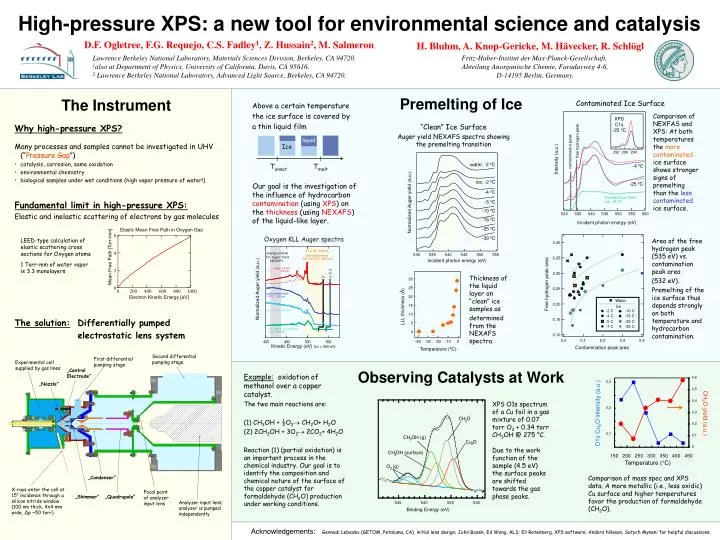
XPS C1s -25 ºC. free hydrogen peak. contamination peak. 292. 288. 284. liquid. Intensity (a.u.). Ice. -4 ºC. T onset. T melt. -25 ºC. Fluorescence Yield, Ice, -25 ºC. 530. 535. 540. 545. 550. 555. 560. Incident photon energy (eV). 0.40. Oxygen KLL Auger spectra. 0.35.

E N D
XPS C1s -25 ºC free hydrogen peak contamination peak 292 288 284 liquid Intensity (a.u.) Ice -4 ºC Tonset Tmelt -25 ºC Fluorescence Yield, Ice, -25 ºC 530 535 540 545 550 555 560 Incident photon energy (eV) 0.40 Oxygen KLL Auger spectra 0.35 E of valence kin energy window 0.30 photoelectrons for Auger Yield for hv=530...560 eV NEXAFS Free hydrogen peak area 0.25 1b v a p o r , 0 . 5 t o r r 1 2 . 0 t o r r 3a 1 30 1b 2a 2 1 Water 0.20 ----------------------------------- 25 Ice Normalized Auger yield (a.u.) -2 C -10 C 20 s u p e r c o o l e d w a t e r -15 C -4 C - 1 0 º C , 1 . 9 5 t o r r 0.15 -25 C -5 C 15 LLL thickness (Å) -39 C -7 C i c e , - 1 0 º C , 1 . 9 5 t o r r 10 0.10 5 0.0 0.1 0.2 0.3 0.4 Contamination peak area i c e , - 8 5 º C , p < 0 . 0 1 t o r r 0 ( h v = 5 6 0 e V ) -40 -30 -20 -10 0 4 0 0 4 5 0 5 0 0 5 5 0 Kinetic Energy (eV) (hv = 569 eV) Temperature (ºC) 0,6 0,3 0,5 0,4 XPS O1s spectrum of a Cu foil in a gas mixture of 0.07 torr O2 + 0.34 torr CH3OH @ 275 °C. Due to the work function of the sample (4.5 eV) the surface peaks are shifted towards the gas phase peaks. 0,2 O1s Cu2O intensity (a.u.) CH2O yield (a.u.) 0,3 - CH O 0,2 3 0,1 0,1 CH OH (g) 3 Cu O 0 2 150 200 250 300 350 400 450 CH OH (surface) 3 Temperature (°C) O (g) 2 Comparison of mass spec and XPS data. A more metallic (i.e., less oxidic) Cu surface and higher temperatures favor the production of formaldehyde (CH2O). 545 540 535 530 Binding Energy (eV) High-pressure XPS: a new tool for environmental science and catalysis D.F. Ogletree, F.G. Requejo, C.S. Fadley1, Z. Hussain2, M. Salmeron H. Bluhm, A. Knop-Gericke, M. Hävecker, R. Schlögl Lawrence Berkeley National Laboratory, Materials Sciences Division, Berkeley, CA 94720. 1also at Department of Physics, University of California, Davis, CA 95616. 2 Lawrence Berkeley National Laboratory, Advanced Light Source, Berkeley, CA 94720. Fritz-Haber-Institut der Max-Planck-Gesellschaft, Abteilung Anorganische Chemie, Faradayweg 4-6, D-14195 Berlin, Germany. Premelting of Ice The Instrument Contaminated Ice Surface Above a certain temperature the ice surface is covered by a thin liquid film Comparison of NEXFAS and XPS: At both temperatures the more contaminated ice surface shows stronger signs of premelting than the less contaminated ice surface. “Clean” Ice Surface Auger yield NEXAFS spectra showing the premelting transition Why high-pressure XPS? Many processes and samples cannot be investigated in UHV (“Pressure Gap”) • catalysis, corrosion, some oxidation • environmental chemistry • biological samples under wet conditions (high vapor pressure of water!) water, -2 ºC ice, -2 ºC Our goal is the investigation of the influence of hydrocarbon contamination (using XPS) on the thickness (using NEXAFS)of the liquid-like layer. -4 ºC -5 ºC Fundamental limit in high-pressure XPS: Elastic and inelastic scattering of electrons by gas molecules Normalized Auger yield (a.u.) -10 ºC -15 ºC -25 ºC Elastic Mean Free Path in Oxygen Gas 6 -39 ºC LEED-type calculation of elastic scattering cross sections for Oxygen atoms 1 Torr-mm of water vapor is 3.3 monolayers Area of the free hydrogen peak (535 eV) vs. contamination peak area (532 eV). Premelting of the ice surface thus depends strongly on both temperature and hydrocarbon contamination. 4 530 535 540 545 550 555 Mean Free Path [Torr-mm] Incident photon energy (eV) 2 Thickness of the liquid layer on “clean” ice samples as determined from the NEXAFS spectra 0 0 200 400 600 800 1000 Electron Kinetic Energy [eV] The solution: Differentially pumped electrostatic lens system Second differential pumping stage First differential pumping stage Experimental cell supplied by gas lines „Control Electrode“ Observing Catalysts at Work Example: oxidation of methanol over a copper catalyst. The two main reactions are: (1) CH3OH + ½O2 CH2O+ H2O (2) 2CH3OH + 3O2 2CO2+ 4H2O Reaction (1) (partial oxidation) is an important process in the chemical industry. Our goal is to identify the composition and chemical nature of the surface of the copper catalyst for formaldehyde (CH2O) production under working conditions. „Nozzle“ „Condenser“ X-rays enter the cell at 15° incidence through a silicon nitride window (100 nm thick, 4x4 mm wide, Δp ~50 torr) Focal point of analyzer input lens „Skimmer“ „Quadrupole“ Analyzer input lens; analyzer is pumped independently Acknowledgements:Gennadi Lebedev (GETOM, Petaluma, CA), initial lens design; John Bozek, Ed Wong, ALS; Eli Rotenberg, XPS software; Anders Nilsson, Satych Myneni for helpful discussions.