Download
1 / 39
460 likes | 1.14k Views
Example 1A: Extending Geometric Sequences . Find the next three terms in the geometric sequence. 1, 4, 16, 64,…. Step 1 Find the value of r by dividing each term by the one before it. 1 4 16 64. The value of r is 4. 4 4 4.

E N D
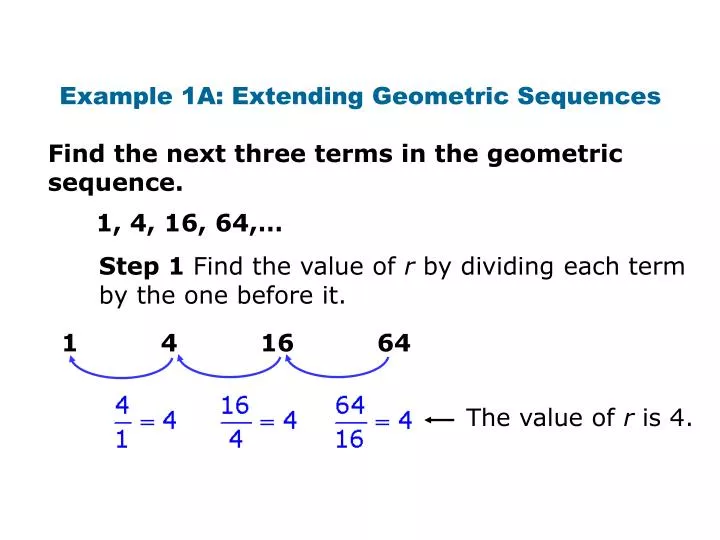
Example 1A: Extending Geometric Sequences Find the next three terms in the geometric sequence. 1, 4, 16, 64,… Step 1 Find the value of r by dividing each term by the one before it. 1 4 16 64 The value of r is 4.
4 4 4 Example 1A Continued Find the next three terms in the geometric sequence. 1, 4, 16, 64,… Step 2 Multiply each term by 4 to find the next three terms. 64 256 1024 4096 The next three terms are 256, 1024, and 4096.
– The value of r is . Example 1B: Extending Geometric Sequences Find the next three terms in the geometric sequence. Step 1 Find the value of r by dividing each term by the one before it.
Helpful Hint When the terms in a geometric sequence alternate between positive and negative, the value of r is negative.
Step 2 Multiply each term by to find the next three terms. The next three terms are Example 1B Continued Find the next three terms in the geometric sequence.
Check It Out! Example 1a Find the next three terms in the geometric sequence. 5, –10, 20,–40,… Step 1 Find the value of r by dividing each term by the one before it. 5 –10 20 –40 The value of r is –2.
Check It Out! Example 1a Continued Find the next three terms in the geometric sequence. 5, –10, 20,–40,… Step 2 Multiply each term by –2 to find the next three terms. –40 80 –160 320 (–2) (–2) (–2) The next three terms are 80, –160, and 320.
A function rule that describes the pattern above is f(x) = 2(3)x. This type of function, in which the independent variable appears in an exponent, is an exponential function. Notice that 2 is the starting population and 3 is the amount by which the population is multiplied each day.
Example 1A: Evaluating an Exponential Function The function f(x) = 500(1.035)x models the amount of money in a certificate of deposit after x years. How much money will there be in 6 years? f(x) = 500(1.035)x Write the function. Substitute 6 for x. f(6) = 500(1.035)6 Evaluate 1.0356. = 500(1.229) = 614.63 Multiply. There will be $614.63 in 6 years.
Remember that linear functions have constant first differences and quadratic functions have constant second differences. Exponential functions do not have constant differences, but they do have constant ratios. As the x-values increase by a constant amount, the y-values are multiplied by a constant amount. This amount is the constant ratio and is the value of b in f(x) = abx.
+ 1 3 3 + 1 3 + 1 Example 2A: Identifying an Exponential Function Tell whether each set of ordered pairs satisfies an exponential function. Explain your answer. {(0, 4), (1, 12), (2, 36), (3, 108)} This is an exponential function. As the x-values increase by a constant amount, the y-values are multiplied by a constant amount.
+ 1 + 64 + 1 + 64 + 1 + 64 Example 2B: Identifying an Exponential Function Tell whether each set of ordered pairs satisfies an exponential function. Explain your answer. {(–1, –64), (0, 0), (1, 64), (2, 128)} This is not an exponential function. As the x-values increase by a constant amount, the y-values are not multiplied by a constant amount.
+ 1 – 1 + 1 + 1 + 3 + 1 Check It Out! Example 2a Tell whether each set of ordered pairs satisfies an exponential function. Explain your answer. {(–1, 1), (0, 0), (1, 1), (2, 4)} This is not an exponential function. As the x-values increase by a constant amount, the y-values are not multiplied by a constant amount.
+ 1 0.5 0.5 + 1 0.5 + 1 Check It Out! Example 2b Tell whether each set of ordered pairs satisfies an exponential function. Explain your answer. {(–2, 4), (–1 , 2), (0, 1), (1, 0.5)} This is an exponential function. As the x-values increase by a constant amount, the y-values are multiplied by a constant amount.
To graph an exponential function, choose several values of x (positive, negative, and 0) and generate ordered pairs. Plot the points and connect them with a smooth curve.
• • • • Check It Out! Example 3a Graph y = 2x. Choose several values of x and generate ordered pairs. Graph the ordered pairs and connect with a smooth curve.
• • • • Example 3: Graphing y = abx with a > 0 and b > 1 Graph y = 0.5(2)x. Choose several values of x and generate ordered pairs. Graph the ordered pairs and connect with a smooth curve.
y =– (2)x • • • • 1 4 Example 4: Graphing y = abx with a < 0 and b > 1 Choose several values of x and generate ordered pairs. Graph the ordered pairs and connect with a smooth curve.
1 y = –1()x 4 Example 5A: Graphing y = abx with 0 < b < 1 Graph each exponential function. Graph the ordered pairs and connect with a smooth curve. Choose several values of x and generate ordered pairs. x
y = 4()x • 1 4 • • • Check It Out! Example 5a Graph each exponential function. Graph the ordered pairs and connect with a smooth curve. Choose several values of x and generate ordered pairs. x
The box summarizes the general shapes of exponential function graphs. a > 0 a > 0 a < 0 a < 0 For y = abx, if b > 1, then the graph will have one of these shapes. For y = abx, if 0 < b < 1, then the graph will have one of these shapes.
Exponential growth occurs when an quantity increases by the same rate r in each period t. When this happens, the value of the quantity at any given time can be calculated as a function of the rate and the original amount.
Example 1: Exponential Growth The original value of a painting is $9,000 and the value increases by 7% each year. Write an exponential growth function to model this situation. Then find the painting’s value in 15 years. Step 1 Write the exponential growth function for this situation. y =a(1 + r)t Write the formula. Substitute 9000 for a and 0.07 for r. = 9000(1 + 0.07)t = 9000(1.07)t Simplify.
Example 1 Continued The original value of a painting is $9,000 and the value increases by 7% each year. Write an exponential growth function to model this situation. Then find the painting’s value in 15 years. Step 2 Find the value in 15 years. y = 9000(1.07)t = 9000(1 + 0.07)15 Substitute 15 for t. Use a calculator and round to the nearest hundredth. ≈ 24,831.28 The value of the painting in 15 years is $24,831.28.
Example 3: Exponential Decay The population of a town is decreasing at a rate of 3% per year. In 2000 there were 1700 people. Write an exponential decay function to model this situation. Then find the population in 2012. Step 1 Write the exponential decay function for this situation. y = a(1 – r)t Write the formula. Substitute 1700 for a and 0.03 for r. = 1700(1 – 0.03)t Simplify. = 1700(0.97)t
Example 3: Exponential Decay The population of a town is decreasing at a rate of 3% per year. In 2000 there were 1700 people. Write an exponential decay function to model this situation. Then find the population in 2012. Step 2 Find the population in 2012. y = 1,700(0.97)12 Substitute 12 for t. Use a calculator and round to the nearest whole number. ≈ 1180 The population in 2012 will be approximately 1180 people.
Reading Math • For compound interest • annually means “once per year” (n = 1). • quarterly means “4 times per year” (n =4). • monthly means “12 times per year” (n = 12).
Example 2A: FinanceApplication Write a compound interest function to model each situation. Then find the balance after the given number of years. $1200 invested at a rate of 2% compounded quarterly; 3 years. Step 1 Write the compound interest function for this situation. Write the formula. Substitute 1200 for P, 0.02 for r, and 4 for n. = 1200(1.005)4t Simplify.
Example 2A Continued Write a compound interest function to model each situation. Then find the balance after the given number of years. $1200 invested at a rate of 2% compounded quarterly; 3 years. Step 2 Find the balance after 3 years. A = 1200(1.005)4(3) Substitute 3 for t. = 1200(1.005)12 Use a calculator and round to the nearest hundredth. ≈ 1274.01 The balance after 3 years is $1,274.01.
Example 2B: Finance Application Write a compound interest function to model each situation. Then find the balance after the given number of years. $15,000 invested at a rate of 4.8% compounded monthly; 2 years. Step 1 Write the compound interest function for this situation. Write the formula. Substitute 15,000 for P, 0.048 for r, and 12 for n. = 15,000(1.004)12t Simplify.
Example 2B Continued Write a compound interest function to model each situation. Then find the balance after the given number of years. $15,000 invested at a rate of 4.8% compounded monthly; 2 years. Step 2 Find the balance after 2 years. A = 15,000(1.004)12(2) Substitute 2 for t. = 15,000(1.004)24 Use a calculator and round to the nearest hundredth. ≈ 16,508.22 The balance after 2 years is $16,508.22.
After deciding which model best fits the data, you can write a function. Recall the general forms of linear, quadratic, and exponential functions.
You have studied different types of functions and how they can be represented as equations, graphs, and tables. Below is a review of three types of functions and some of their key properties.
Example 1A: Graphing Data to Choose a Model Graph each data set. Which kind of model best describes the data? Plot the data points and connect them. The data appear to be exponential.
Example 1B: Graphing Data to Choose a Model Graph each data set. Which kind of model best describes the data? Plot the data points and connect them. The data appears to be linear.
Check It Out! Example 1a Graph each set of data. Which kind of model best describes the data? Plot the data points. The data appears to be exponential.
Check It Out! Example 1b Graph each set of data. Which kind of model best describes the data? Plot the data points. The data appears to be quadratic.