Download
1 / 22
220 likes | 386 Views
The European lime outlook. October 2014 ILA, General assembly, Vancouver Ms. Eleni Despotou. Overview of the presentation. EuLA : who are we ? EU lime markets Quicklime production EU lime industry challenges Conclusions. Who we are:.

E N D
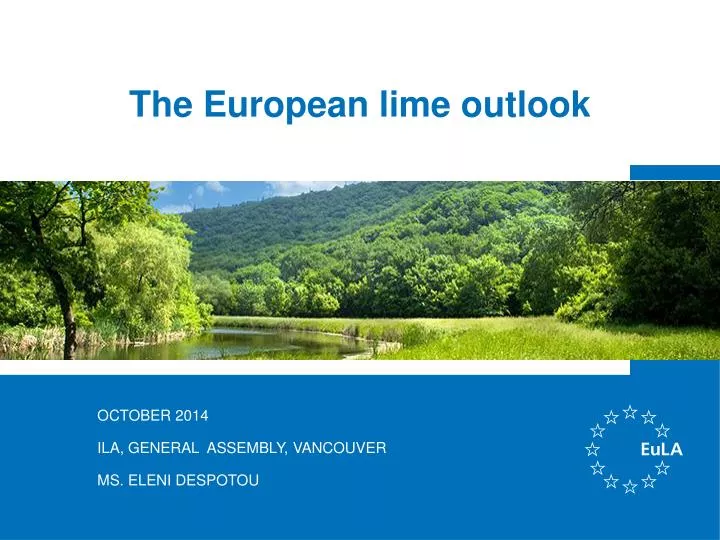
The European lime outlook • October 2014 • ILA, General assembly, Vancouver • Ms. Eleni Despotou
Overview of the presentation • EuLA: who are we? • EU lime markets • Quicklime production • EU lime industry challenges • Conclusions
Whowe are: The European Lime Association, created in 1990, is the voice of the European lime sector. • EuLA provides sector-base representation for the lime industry at European level, including technical, scientific and administrative support to its members on non-commercial issues. This includes: • Addressing the current complex legislative framework; • Speaking with one voice on scientific and technical dossiers; • Managing horizontal sectorial issues of common concern including sustainable development, Corporate Social Responsibility, Health & Safety, Environmental Protection, Energy, Communications and end-of-use product legislation; • Promoting Best Practices.
EuLA Members EuLA Members
EU lime industry challenges • Limited growth or no growth • Stringentlegislation (climate change, environment, energy) • EU policyenvironment • Neighbourhood politicalenvironment • High energycosts and costcompetitiveness Result • Shrinking of the industry
Lime sector – Total CO2 emissions Source: CITL
Quicklime – Process & Combustion CO2 Source: EuLA (database)
EU legislation • EU wordlwide pionner on climate change relatedlegislation • New climate and energy package 2030 • 43% GHG emissionsreductions for industry (binding) • 27% RES contribution (binding at EU level) • 30% Energyefficiency (indicative) VS • 20% target for industry contribution to the EU GDP.(aspirational)
Source: European Commission report on “Energy prices and costs in Europe”, SWD(2014)20, January 2014
European Commission report on “Energy prices and costs in Europe”, SWD(2014)20, January 2014 Source: European Commission report on “Energy prices and costs in Europe”, SWD(2014)20, January 2014
European Commission report on “Energy prices and costs in Europe”, SWD(2014)20, January 2014 Source: European Commission report on “Energy prices and costs in Europe”, SWD(2014)20, January 2014
European Commission report on “Energy prices and costs in Europe”, SWD(2014)20, January 2014 Source: European Commission report on “Energy prices and costs in Europe”, SWD(2014)20, January 2014
European Commission report on “Energy prices and costs in Europe”, SWD(2014)20, January 2014 Source: European Commission report on “Energy prices and costs in Europe”, SWD(2014)20, January 2014
Source: European Commission report on “Energy prices and costs in Europe”, SWD(2014)20, January 2014
Energy and costs competitiveness • As of 2011 the EU dominates the export market for energy-intensive goods, accounting for more than two-thirds of export value, which makes it the largest export region for energy intensive goods. • One can expect that regional price disparities increase the risk of reduced production levels and investment in higher priced countries and bring changes in global trade patterns, in particular affecting industries that have a high share of energy costs and are exposed to international competition because their production is easy and relatively cheap to transport. • This is supported by analysis undertaken by the IEA in the 2013 World Energy Outlook, which shows that persistently high energy price disparities can lead to important differences in economic structure over time and have far-reaching effects on investment, production and trade patterns.
Conclusions Stagnante market due to stagnante economy Limited new Investment Limited perspective to reverse the trend in a short term New mandate for the EU institutions in place…
THANK YOU! www.eula.eu