Download
1 / 10
100 likes | 255 Views
Global Climate Change: Carbon sequestration projects for Pontal do Paranapanema, São Paulo, Brazil. The objective of the activity was to familiarize students with the issue of carbon sequestration as relevant to the system of carbon trading proposed in the Kyoto protocol.

E N D
Global Climate Change:Carbon sequestration projects for Pontal do Paranapanema, São Paulo, Brazil
The objective of the activity was to familiarize students with the issue of carbon sequestration as relevant to the system of carbon trading proposed in the Kyoto protocol. The students prepared projects for carbon sequestration for farms within the Pontal do Paranapanema region.
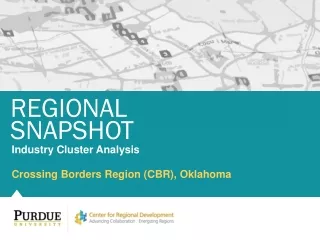
A map of the Pontal region was provided showing farm borders and vegetation cover. Don't be overwelmed by the color scheme! The map was created by researchers from IPÊ (Instituto de Pesquisas Ecolo’gicas) for a study on prioritary areas for biodiversity conservation.
The numbers in the map represent the farms that were used for our carbon sequestration exercise. Only the color scheme for vegetation cover was used: • red and pink areas = primary forest (> 100 years) • dark green areas = secondary forest (5-20 years) • light green areas = river and riparian forest • Remaining area = pasture (The large dark green area is a nature reserve)
The area of each vegetation type within each farm was calculated using ArcView. The results were entered into an Excel model created by The Nature Conservancy. The model calculates the amount and cost of carbon sequestration in a 40-year project.
The model calculates these figures based on: a) the proportion of each vegetation type within the area of the project b) the total area to be used by the project c) the cost for the acquisition of the land d) the risk of each vegetation type of being coverted into pasture if the project is not implemented e) the area to be reforested See what the spreadsheet looks like:
The students were encouraged to cooperate (by combining projects) in order to lower the price per ton of carbon sequestered (the present market price is approximately US$ 5.00, although higher prices are anticipated if a carbon trading system if implemented).
The following are the projects developed by the 2001 SEE-U students in Brazil: Refer to BAF1.ppt through BAF4.ppt