Download
1 / 21
210 likes | 350 Views
Textual Entailment Using Univariate Density Model and Maximizing Discriminant Function. “Third Recognizing Textual Entailment Challenge 2007 Submission” Scott Settembre University at Buffalo, SNePS Research Group ss424@cse.buffalo.edu. Third Recognizing Textual Entailment Challenge (RTE3).

E N D
Textual Entailment Using Univariate Density Model and Maximizing Discriminant Function “Third Recognizing Textual Entailment Challenge 2007 Submission” Scott Settembre University at Buffalo, SNePS Research Group ss424@cse.buffalo.edu
Third Recognizing Textual Entailment Challenge (RTE3) • The task is to develop a system to determine if a given pair of sentences has the first sentence “entail” the second sentence • The pair of sentences is called the Text-Hypothesis pair (or T-H pair) • Participants are provided with 800 sample T-H pairs annotated with the correct entailment answers • The final testing set consists of 800 non-annotated samples
Development set examples • Example of a YES result <pair id=“28" entailment="YES" task="IE" length="short"> <t>As much as 200 mm of rain have been recorded in portions of British Columbia , on the west coast of Canada since Monday.</t> <h>British Columbia is located in Canada.</h> </pair> • Example of a NO result <pair id="20" entailment="NO" task="IE" length="short"> <t>Blue Mountain Lumber is a subsidiary of Malaysian forestry transnational corporation, Ernslaw One.</t> <h>Blue Mountain Lumber owns Ernslaw One.</h> </pair>
Entailment Task Types • There are 4 different entailment tasks: • “IE” or Information Extraction • Text: “An Afghan interpreter, employed by the United States, was also wounded.” • Hypothesis: “An interpreter worked for Afghanistan.” • “IR” or Information Retrieval • Text: “Catastrophic floods in Europe endanger lives and cause human tragedy as well as heavy economic losses” • Hypothesis: “Flooding in Europe causes major economic losses.”
Entailment Task Types - continued • The two remaining entailment tasks are: • “SUM” or Multi-document summarization • Text: “Sheriff's officials said a robot could be put to use in Ventura County, where the bomb squad has responded to more than 40 calls this year.” • Hypothesis: “Police use robots for bomb-handling.” • “QA” or Question Answering • Text: “Israel's prime Minister, Ariel Sharon, visited Prague.” • Hypothesis: “Ariel Sharon is the Israeli Prime Minister.”
Submission Results • The two runs submitted this year (2007) scored: • %62.62 (501 correct out of 800) • %61.00 (488 correct out of 800) • For the 2nd RTE Challenge of 2006, a %62.62 ties for 4th out of 23 teams. • Top scores were %75, %73, %64, and %62.62. • Median: %58.3 • Range: %50.88 to %75.38.
Main Focuses • Create a process to pool expertise of our research group in addressing entailment • Development of specification for metrics • Import of metric vectors generated from other programs • Design a visual environment to manage this process and manage development data set • Ability to select metric vectors and classifier to use • Randomization of off-training sets to prevent overfitting • Provide a baseline to evaluate and compare different metrics and classification strategies
Development Environment • RTE Development Environment • Display and examine the development data set
Development Environment - continued • Select off-training set from development data
Development Environment - continued • Select metric to use for classification
Metrics • Metric specification • Continuous value and normalized between 0 and 1 (inclusive) • Allows future use of nearest-neighbor classification techniques • Prevents scaling issues • Preferably in a Gaussian distribution (bell curve) • Metrics developed for our submission • Lexical similarity ratio (word bag) • Average Matched word displacement • Lexical similarity with synonym and antonym replacement
Metric - example • Lexical similarity ratio (word bag ratio) • # of matches between text and hypothesis / # of words in hypothesis Works for: <t>A bus collision with a truck in Uganda has resulted in at least 30 fatalities and has left a further 21 injured.</t> <h>30 die in a bus collision in Uganda.</h> Wordbag ratio = 7 / 8 Fails for: <t>Blue Mountain Lumber is a subsidiary of Malaysian forestry transnational corporation, Ernslaw One.</t> <h>Blue Mountain Lumber owns Ernslaw One.</h> Wordbag ratio = 5 / 6 • Weakness: does not consider semantic information
Development Environment - continued • Classify testing data using Univariate normal model
Classifiers • Two classification techniques were used • Univariate normal model (Gaussian density) • Linear discriminant function • Univariate normal model • One classifier for each entailment type and value • 8 classifiers are developed • Results from the “YES” and “NO” classifiers are compared • Linear discriminant function • One classifier for each entailment type • 4 classifiers are developed • Result based on which side of the boundary the metric is on
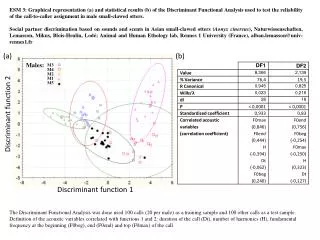
Classifiers - Univariate • Each curve represents a probability density function • Calculated from the mean and variance of the “YES” and “NO” metrics from the training set • To evaluate, calculate a metric’s position on either curve • Use the Gaussian density function • Classify to category with the largest p(x) p(x) No Yes x
Classifiers - Simple Linear Discriminant • Find a boundary that maximizes result • Very simple for a single metric • Brute force search can be used for good approximation x
Classifiers - Weaknesses • Univariate normal weakness • Useless when there is a high overlap of metric values for each category (when mean is very close) • Or metrics are not distributed on a Gaussian “bell” curve Overlap Non Gaussian distribution • Simple linear discriminant weaknesses • Processes 1 metric in training vector • Placed a constraint on metric values (0 for no entailment, 1 for max entailment)
Development Environment - continued • Examine results and compare various metrics
Results • Combined each classification technique with each metric • Based on training results, the classifier/metric combination was selected for use in challenge submission Training Results Final results from competition set
Future Enhancements • Use of multivariate model to process metric vector • Ability to use more than one metric at a time to classify • Add more metrics that consider semantics • Examination of incorrect answers show that a modest effort to process semantic information would yield better results • Current metrics only use lexical similarity • Increase ability for tool to interface in other ways • Currently we can process metrics from Matlab, COM and .NET objects, and pre-processed metric vector files
RTE Challenge - Final Notes • See our progress at: http://www.cse.buffalo.edu/~ss424/rte3_challenge.html • RTE Web Site: http://www.pascal-network.org/Challenges/RTE3/ • Textual Entailment resource pool: http://aclweb.org/aclwiki/index.php?title=Textual_Entailment_Resource_Pool • Actual ranking released in June 2007 at: http://www.pascal-network.org/Challenges/RTE3/Results/ April 13, 2007 CSEGSA Conference Scott Settembre