Download
1 / 25
250 likes | 364 Views
Edward Trettel Northwest Airlines, Inc. edd.trettel@nwa.com edd.trettel@comcast.net 612-726-7434 (w) 763-780-3941 (h) 763-438-6244 (m). Contact Info. THE UNSUCCESSFUL SELF-TREATMENT OF A CASE OF "WRITER'S BLOCK"'. Click to Add Title. FORECASTING DATABASE DISK SPACE REQUIREMENTS:

E N D
Edward Trettel Northwest Airlines, Inc. edd.trettel@nwa.com edd.trettel@comcast.net 612-726-7434 (w) 763-780-3941 (h) 763-438-6244 (m) Contact Info
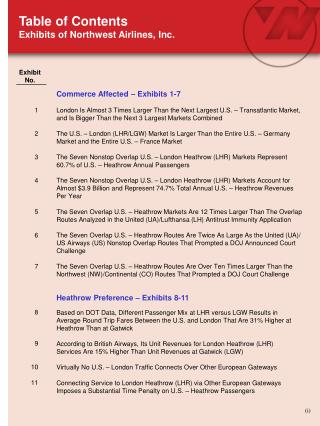
THE UNSUCCESSFUL SELF-TREATMENT OF A CASE OF "WRITER'S BLOCK"' Click to Add Title FORECASTING DATABASE DISK SPACE REQUIREMENTS: A POOR MAN’S APPROACH
Which Shape do you prefer? Personality Inventory Linear thinker. Precise. Accurate. Analytical. Tactical. Holistic thinker. Creative. Artistic. Strategic. Obsessed with Queuing Theory
Northwest Airlines is the world's fourth largest airline • With its global travel partners, NWA serves over: • 750 destinations • In 120 countries • On 6 continents. • The U.S. system spans 49 states and DC • Hub Cities: • Amsterdam • Detroit • Memphis • Minneapolis/St. Paul • Tokyo
NWA’s Distributed Database Environment: Sybase, Oracle, UDB, MS SQL Server 200 Database Instances 400 Databases Hosting Operating Systems: Sun Solaris IBM Aix Windows Server “Necessity, who is the mother of invention.”Plato, The Republic
1,660 pager events per year on distributed database issues. 1,041 (62%) of these were for databases exceeding their 95% disk space full limits. At 100% full the database stops processing. Management of these 400 databases’ disk space needs was being done in a reactive, day-to-day manner by staff looking at the individual values inside each databases, using DBMS-specific interfaces. The Problem
Databases, Tablespaces, andFile Systems File System Tablespace
200 Database Instances Hosting 400 Databases Consisting of 2,800 tablespaces Made up of 5,100 OS files These resources were managed reactively using good ‘ol “IEB-eyeball” Scope of the Problem
Gather a small number of database disk space size metrics from each of these databases on an automatic, daily, unattended basis and put them into a database. Apply regression analysis techniques to see if there were any consistent growth (or decline) rates over the course of a year. Create forecasts on a per data holder basis, beaming out six months in the future. Leverage other descriptive statistics as well. Provide for multi-dimensional analyses. The SolutionOctober 2000 to Present
Introduced as a a common construct across the disparate Sybase, Oracle, and UDB architectures. Refers to: “Tablespaces” (and “datafiles”, “containers”) in Oracle and UDB Database devices and databases in Sybase. The “Data Holder” Concept
The date and time of the collection The instance name The DBMS type (Sybase, Oracle, UDB) The tablespace or database name The number of bytes_allocated to this tablespace or database The number of bytes_free in this tablespace or database The number of bytes_used (derived as the difference between the number allocated and number free) (All gathered into a single table in a database) The Collected Data
Straightforward SELECT statement Gather size information from an instance’s data dictionary or “system catalog” Zero-maintenance. Have run daily and unattended for 6 years Simplicity The Collectors
Used MS OLAP Services Vetted “time” against Bytes Used on a per data holder, per instance basis. Used a year’s worth of daily observations. y = mx + b Bytes Used = slope(date) + constant Where will we be six months from now? y′ = m(current date+180) +b Will we have a surplus or a deficit in disk space then? Current Date Bytes Allocated - y′ 100GB - 87GB = 13GB (surplus) 78GB - 87GB = -9GB (deficit) Regression Analysis
A Number of Derived Measures Bytes Used:(bytes_allocated – bytes_free) Percent Used(Bytes_used/bytes_allocated)*100 Percent Free(bytes_free/bytes_allocated)*100 Benefits of Having the Data
The Pearson product moment correlation coefficient (R2) Values ranged all over the place from 0 to 1. Since this number equates to the percent of the variance observed in the dependent variable (bytes used) that’s accounted for by the independent variable (time), we were able assess the reliability (and usability) of our forecasts. Correlation
Pivot tables of Time (along the x-axis) vs. Bytes Used (along the y-axis) were constructed along these dimensions: DBMS Name (Sybase, Oracle, UDB) Instance Name Data Holder Name This permitted dicing-and-slicing the data in a number of ways. Beyond Forecasting:Additional Insights Provided by the Data
What’s the pattern of bytes_used over the past year for: All Oracle instances? All Sybase instances? All UBD instances? Oracle and Sybase combined? Oracle and UDB combined? Sybase and UDB combined? Sybase and Oracle and UDB combined? Questions Askedand Answered
What’s the pattern of bytes_used over the past year for: Any individual instance? Any combination of instances? (Note this also permits any combinations of instances of interest, regardless of the DBMS that’s hosting them.) Questions Askedand Answered
What’s the pattern of bytes_used over the past year for: Any individual data holder? (Note that one must enter an instance name for this to be meaningful. Otherwise it would show the total value for all data holders that have that name, regardless of the instance name.) Any combination of data holders? Questions Askedand Answered
With this data now published on a regular monthly basis to the intranet, the consumers of it have gained considerable insights into the seasonal and other variations in their data usage patterns. The work group which is responsible for acquiring disk space for the entire IS organization can now set realistic budget values for next year’s disk space requirements, based upon the higher level rollups of the bytes_used data. Pager call reduction: the 1,041 pages that were previously issued per year for database disk space problems dropped to only a handful. Benefits
The rates of growth of the various applications or business systems at the organization were now quantified and published. This allowed the IT organization to compare those rates between applications, year-over-year, etc. The organization can now identify any anomalous rates that might indicate that an application change (intended or not) or business driver variation was having a significant impact on the rate at which data was being accrued in a database. Descriptive statistics can be compared between data holders to better understand their central tendencies and dispersion characteristics. Benefits – The Sequel
“Statistics is the grammar of science.” Karl Pearson British mathematician and statistician (1857 - 1936)
Questions ? Thank you !!! Pizza !!!!!!!!!