Download
1 / 1
10 likes | 126 Views
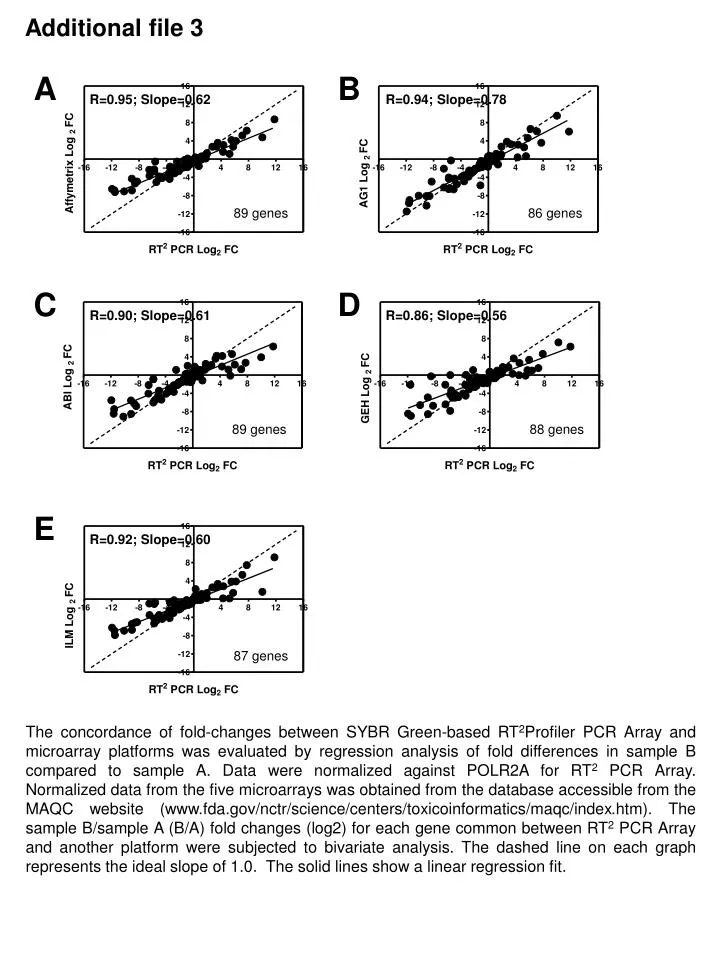
89 genes. 89 genes. 86 genes. 88 genes. 87 genes. Additional file 3. A. B. R=0.95; Slope=0.62. R=0.94; Slope=0.78. C. D. R=0.90; Slope=0.61. R=0.86; Slope=0.56. E. R=0.92; Slope=0.60.

E N D
89 genes 89 genes 86 genes 88 genes 87 genes Additional file 3 A B R=0.95; Slope=0.62 R=0.94; Slope=0.78 C D R=0.90; Slope=0.61 R=0.86; Slope=0.56 E R=0.92; Slope=0.60 The concordance of fold-changes between SYBR Green-based RT2Profiler PCR Array and microarray platforms was evaluated by regression analysis of fold differences in sample B compared to sample A. Data were normalized against POLR2A for RT2 PCR Array. Normalized data from the five microarrays was obtained from the database accessible from the MAQC website (www.fda.gov/nctr/science/centers/toxicoinformatics/maqc/index.htm). The sample B/sample A (B/A) fold changes (log2) for each gene common between RT2 PCR Array and another platform were subjected to bivariate analysis. The dashed line on each graph represents the ideal slope of 1.0. The solid lines show a linear regression fit.