Download
1 / 142
1.42k likes | 1.64k Views
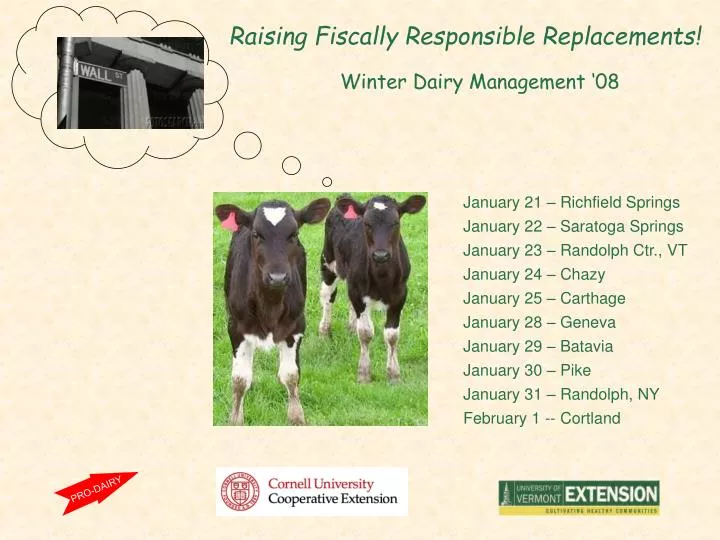
Raising Fiscally Responsible Replacements!. Winter Dairy Management ‘08. January 21 – Richfield Springs January 22 – Saratoga Springs January 23 – Randolph Ctr., VT January 24 – Chazy January 25 – Carthage January 28 – Geneva January 29 – Batavia January 30 – Pike

E N D
Raising Fiscally Responsible Replacements! Winter Dairy Management ‘08 January 21 – Richfield Springs January 22 – Saratoga Springs January 23 – Randolph Ctr., VT January 24 – Chazy January 25 – Carthage January 28 – Geneva January 29 – Batavia January 30 – Pike January 31 – Randolph, NY February 1 -- Cortland Winter Dairy Management ‘08
To: For the “loan” of: Jenny Mills Dr. Bill Stone & Dr. Doug Waterman This project could not have been pulled off without their help and all of the folks below: Site Managers Dave Balbian Cathy Wickswat Colleen Leonard, UVM Blake Putnam Frans Vokey Ron Kuck Jerry Bertoldo Maureen Zorn Rebecca Ireland-Perry Lisa Kempisty Joan Petzen John Conway Development Team Dr. Mike Van Amburgh Jenny Mills Dr. Julie Smith, UVM Dr. Jerry Bertoldo Jason Karszes Cathy Wickswat Curt Gooch Frans Vokey Dave Balbian Ron Kuck John Conway
Special thanks to the folks at Midland BioProducts for upplying both the Colostrum and IgG (used on Case Farms, see back) Quick Test Kits!
Take advantage of what’s bred into them with: Targeted Heifer Growth An easy-to-use guide where you determine age at first freshening To get PowerPoint File for printing additional graph pages go to: http://www.ansci.cornell.edu/prodairy/heiftarget
Practical Application of Targeted Heifer Growth for Optimal Financial Returns: Get mature weights or adjusted mature weights (see chart) for all cows in herd Based on dam’s mature weight, separate heifers into small, medium or large predicted mature weight; fewer categories if cow-to-cow variation is less Choose a target mature size for small, medium and large mature size heifers Choose an age in months at freshening target either for all sizes or per size based on your farm specific environmentconstraints Consult with Feed Rep and run diets taking into account size, average daily gain targets and accurate environmental description. Feeding a separate energy grain from protein grain allows maximum flexibility. Of course, all forages fed need to be accurately identified and analyzed. Winter environments present the greatest challenges! Use sentry heifers to measure scheduled bodyweight and body condition (or hip height) scores. Evaluate if out of compliance and make needed adjustments. A random 20% of a group such as the “Breeding Age” heifers may give you an accurate gauge on whether you’re hitting the “55% of Mature Weight” target for the age at calving you are shooting for.
To get PowerPoint File for printing additional graph pages go to: http://www.ansci.cornell.edu/prodairy/heiftarget
Dykeman & Sons, Fultonville, NY Reyncrest Dairy The Reynolds Family, Corfu, NY Dan and Sharon Rossiter, Belleville, NY Koval Brothers Dairy, Stillwater, NY
Heifer Management Evaluation Snapshot – Two Components Optimize Pre- Weaning Gains Herd Birth Rate (Freshening events as % avg. cow nos.) ≥108%* *distorted during expansion (115% Dykeman) % Heifers Born (Female births divided by all births) ≥46 – 47% (55 – 60% sexed semen) (46% Dykeman) % Heifers DOA (≤ 24 hrs.) (Female births DOA divided by all births) ≤5% (5% Dykeman) Annualized Heifer Cull Rate (Heifers died/culled divided by avg. # heifers) ≤3%* *distorted during Expansion 24 hrs. 3 mos. ____ 4 mos. fresh ____ (2% Dykeman) Age at First Calving (Months) (Age and standard deviation) 23 ± 2.5 mos. SD (& 82 – 85% Mature Wt.) (23 ± 2.1 Dykeman) Double birth weight In 56 days ≥90% achieving 1.85x (avg.) 14%* (Dykeman) *Currently battling E Coli strain Nail Biological Growth Targets 55% mature weight @ breeding 82 - 85% mature weight @ 1st calving ≥90% achieving *Breeding: Avg. 56% MW (69% Achieving) *Calving: Avg. 78% MW (14% Achieving) (Dykeman) Dykeman Case Farm Biological Advantage Scorecard (BAS) Factors Affecting Ability to Generate Profit & First Lactation Milk Blood IgG >10mg/ml or Blood serum protein >5.5g/dl (at 48 hours of life) ≥85% achieving (95% is achievable) (86%* Dykeman) *2 calves receiving colostrum replacement did not achieve What Makes a “Quality Heifer” -- Maintaining Management Momentum (Dykeman) Passive Immunity Achievement 1st Calf “Treated” as Calf/Heifer* ≤ 30%? 24 hrs. 3 mos. ____ 4 mos. fresh ____ DOAs in first calf heifers ≤ 9%19% Male DOAs 19% Female DOAs 19% 1st Calf avg. peak ≥ 80% of Mature71% or total lactation ≥ 80% of Mature80% 1st Calf Culls ≤ 60 Days in Milk ≤ 5%5% 1st Calf ME’s ≥ Mature< (-595) 1st Calf “Treated” in Lactation* ≤ 15%? ≥ 85% retention (any herd) to 2nd lactation 90% Reduce #1 reason for 1st lactation culls (continuous improvement) Repro Replacement Generation Capacity (RGC)* Longer Term – Factors Affecting Asset Growth (IHG) *Adapted from Farm Credit’s Business Consultants’ Heifer Management Index
REPLACEMENT PROGRAM, Importance to the Dairy Jason Karszes Farm Management Specialist PRO-DAIRY Cornell University Cathy Wickswat Farm Management/Dairy Extension Educator Cornell Cooperative Extension Rensselaer County
Goal of The Replacement Program The primary goal of all heifer programs is to raise the highest quality heifer who will maximize profits once she enters the lactating herd. A quality heifer is one carrying no limitations into the dairy herd that would hinder her ability to produce under the farm’s management system. Profits are maximized by obtaining the quality heifer at the lowest possible cost.
Impact of The Replacement Enterprise The bottom line of a dairy is impacted by: • Costs • Direct • In-direct • Number of animals being raised • Quality of the animals
Relationship with the Dairy • Total cost to raise heifer • Number of heifers being raised • Age of first calving • Investment in replacement enterprise • Quality of heifer enterprise • Number of animals needed by dairy • Cull rate
What is the Impact? • How does the replacement enterprise impact the dairy business performance? • Setting the base • Treat heifer enterprise as a separate business • Set budget for dairy to buy heifers • Current performance • Map changes in performance
300 cow dairy Stable herd size 36% cull rate, last 5 years Budgeted expense per heifer = $2,200 Sell calves for $600 Cost/day, raising costs (cash), per heifer = $1.70 Age of first calving = 27 months Capital invest./ heifer = $700 % heifers cull rate per year = 7% Base Scenario
Replacement Enterprise - Base • Number of heifers needed to maintain herd size = 264 • Total cost per day per heifer completing system = $2.28(cash cost + depreciation + non-performance expense) • Total cost of animal = $1,874(no beginning value or interest on investment) • Net enterprise income = -$17,359 • Total investment in enterprise = $590,100 • % return on total investment = -2.94% • Overall dairy business % return = 6.8% Enterprise Impact
Changes that Can Be Made • Lower raising costs • Decrease calving age • Decrease number needed – dairy cull rate • Decrease replacement cull rate • Improve quality of animal • Do them all
Summary Table – Replacement Only Enterprise Impact Calculator Net Enterprise Total Return on Number Income Investment Investment Raised Base -$17,359 $590,100 -2.94% 264 Cost -$7,730 $578,068 -1.34% 264 Age $2,198 $476,397 0.46% 225 Dairy Cull% -$14,466 $491,750 -2.94% 220 Heifer Cull% -$6,051 $550,335 -1.10% 254 Premium Paid -$14,743 $600,328 -2.46% 264 Combined $22,958 $365,799 6.28% 179 Comb w int. inv. $18,065 $429,819 4.20% 179 Comb sell excess $28,032 $499,767 5.61% 233
Summary Table – Overall Business Enterprise Impact Calculator Net Farm Total Return on Number Income Investment Investment Raised Base $180,930 $2,690,100 6.80% 264 Cost $190,558 $2,678,068 7.19% 264 Age $200,487 $2,576,397 7.86% 225 Dairy Cull% $204,823 $2,591,750 7.98% 220 Heifer Cull% $192,238 $2,650,335 7.33% 254 Premium Paid $183,546 $2,700,328 6.87% 264 Combined $242,278 $2,465,799 9.91% 179 Comb w int. inv. $237,354 $2,529,819 9.46% 179 Comb sell excess $249,321 $2,529,819 9.59% 233
What is The Cost? • They are free? • Just purchased feed? • Just hired labor? • The sum of: • All inputs, cash and non-cash • Fixed costs associated with capital investments • Opportunity cost of capital • Charges for animals not completing replacement program.
Michigan 1973 $617 1980 $1,085 1986 $1,177 Wisconsin 1982 $1,549 1987 $1,326 1998 $1,099 2000 $1,360 Washington 1992 $1,242 Pennsylvania 1998 $1,088 1985 $925 Low $1,271 Medium $1,597 High Idaho 1992 $1,159 New York 1990 $1,265 1993 $1,150 2003 $1,429 2007-8 $1,682 Reported Costs to Raise Dairy Replacements
What is The Cost? • Hard to know what the “Average” is. • Few farms treat the replacement enterprise as a separate business and know their actual costs. • Can use various tools to estimate what costs may be for different areas of the system.
The Big Two • Feed • Is enough grown? • Proper quality? • How much purchased? • How much does it cost? • Where is the manure going?
The Big Two • Labor • Is it doing a good job? • How much is it costing? • Does it have the right tools? • How efficient/inefficient is the set-up? • Size of barns • Hand labor • Location/design of facilities • “Free” barns may cost too much!
The Big Two • Feed and Labor • 60%-70% of the total costs to raise heifers • Are they being used efficiently? • Is a quality heifer being produced?
Number of Heifers • How many total heifers are being raised? • How many are needed to maintain herd size? • How many are needed to offset heifer cull rate? • Investment level • How much barn space? • How much equipment? • Dollar value of heifers • Net Income is divided by investment to determine profitability
Number of Heifers • Two - 200 cow dairies • One has 130 total heifers in system? • One has 180 total heifers in system? • Who has less barns, equipment, bunks, etc?
Age of First Calving • Number of heifers needed • Production life • Investment level
Quality of the Replacement • Growth vs. milk • Calving problems • Too heavy (fat) • Too light (frame) • General condition of the animal • Mastitis • Feet and legs • Injury • Prior treatment(s)
Summary • Quality heifers should be the first focus. • Need to look at all costs to raise heifers. • Impact on the dairy business performance is more than the cost to raise a heifer. • Number of heifers being raised, number of animals needed by the dairy to maintain herd size, and quality of heifer play significant role.
Costs to Raise Dairy Replacements • 12 Farms completed in time for meetings • 5 additional farms being summarized • Final report will be available on the website with other materials from this program • Snapshot of how much spent to raise heifers last 3 months of 2007 • Used to estimate total spent in raising the replacement over the 23 months.