Download
1 / 39
670 likes | 1.76k Views
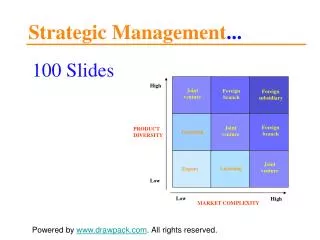
Overview of Corporate Strategy Miles and Snow Typologies Porter’s Generic Strategies Barney’s Resource-Based Theory Distinctive Capabilities Matching Strategy and Capabilities Corporate Culture Country Culture. Overview of Corporate Strategy. Strategy :

E N D
Overview of Corporate Strategy Miles and Snow Typologies Porter’s Generic Strategies Barney’s Resource-Based Theory Distinctive Capabilities Matching Strategy and Capabilities Corporate Culture Country Culture
Overview of Corporate Strategy Strategy: A course of action or plan designed to accomplish a specific goal or objective. Generic Strategies Miles and Snow Strategic Typologies Porter’s Generic Strategies Barney’s Resource Based Theory
Miles and Snow Strategic Typologies Defenders Reactors Analyzers Prospectors
Miles and Snow Strategic Typologies Defenders: Highly expert at producing and marketing a few products in a narrowly defined market. Opportunities beyond the present may not be sought. Few adjustments in technology, organization structure, and methods of operation because of narrow focus.
Miles and Snow Strategic Typologies Reactors: Frequently unable to respond quickly to perceived changes in environment. Make adjustments only when finally forced to do so by environmental pressures. Reactors wait for adversity (i.e., declining sales) before taking corrective steps.
Miles and Snow Strategic Typologies Analyzers: Simultaneous operations in stable and changing product market domains. In relatively stable product/market domain, emphasis on formalized structures and processes to achieve routine and efficient operations. In changing product/market domain, emphasis on detecting and copying competitors most promising ideas. Associated with “Me Too” products.
Miles and Snow Strategic Typologies Prospectors: Primary attention devoted to searching for new market opportunities. Frequent development and testing of new products and services. Source of change and uncertainty for competitors. Loss of efficiency because of continual product and market innovation.
Overview of Corporate Strategy Miles and Snow Typologies Porter’s Generic Strategies Barney’s Resource-Based Theory Distinctive Capabilities Matching Strategy and Capabilities Corporate Culture Country Culture
Porter’s Generic Strategies Low Cost vs Differentiation External Oriented Threats and Opportunities Barney’s Resource Based Theory Distinctive Capabilities Internal Oriented Strengths and Weaknesses
The Relationship Between Barney’s Resource-based Theory & Porter’s Generic Strategy (SWOT Analysis) Barney’s Resource Based-Theory Porter’s Generic Strategy Strengths Weaknesses Threats Opportunities Internal Analysis External Analysis
Distinctive Capabilities Distinctive Capabilitiesare “complex bundles of skills and accumulated knowledge, exercised through organizational processes, that enable firms to make use of their assets and functions like a key success factor (Day 1994).”
Process Capabilities • Correlation with Significance • Capability Performance Level • Low Logistics Cost 0.179 0.068 * • Operational Simplification 0.053 0.325 * • Operational Standardization 0.151 0.099 * • Problem Avoidance 0.155 0.091 * • Product Introduction 0.337 0.001 * • Product Phase Out 0.076 0.255 • Product Recall 0.107 0.181 • Responsiveness to Key Customers 0.214 0.035 * • Reverse Logistics Timing 0.129 0.153 • Selective Distribution Coverage 0.120 0.155
Differentiation Capabilities • Correlation with Significance • Capability Performance Level • Value-Added Services 0.289 0.005 * • Advanced Shipment Notification 0.099 0.197 • Customer Service Flexibility 0.247 0.015 * • Delivery Dependability 0.268 0.001 * • Delivery Speed 0.122 0.147 • Delivery Time Flexibility 0.013 0.455 • Disruption in Supply 0.178 0.062 * • Expedited Delivery 0.144 0.108 • Innovativeness 0.080 0.247 • Location Flexibility 0.106 0.185
Differentiation Capabilities • Correlation with Significance • Capability Performance Level • Problem & Complaint Resolution 0.140 0.113 • Process Flexibility 0.218 0.030 * • Product Flexibility 0.394 0.002 * • Product Flexibility During Logistics 0.193 0.059 * • Product Innovation 0.200 0.041 * • Volume Flexibility 0.106 0.231 • Order Fill Capacity 0.218 0.029 * • Order Flexibility 0.397 0.001 • Widespread Distribution Coverage 0.127 0.139
Overview of Corporate Strategy Miles and Snow Typologies Corporate Culture Porter’s Generic Strategies Barney’s Resource-Based Theory Distinctive Capabilities Matching Strategy and Capabilities Emerging Strategies
Matching Capabilities to Strategies Strategy Cost Leadership Differentiation Low Cost Capabilities (Processes) Poor Performance Good Performance Capabilities Differentiation Capabilities (Value-Added Services) Poor Performance Good Performance
Logistics Strategy, Capabilities, and Performance in the Retail Grocery Industry Logistics Capabilities Firm Performance Strategy Process Capabilities H9: = -.27 (t = -1.43) H1: = .74 (t = 3.96) H3: = .25 (t = 1.82) H5: = .54 (t = 3.05) Cost Leadership Performance H4: = -.20 (t = -1.65) H6: = .33 (t = 2.61) Differentiation H2: = .30 (t = 2.33) H10: = .21 (t =1.68) H7 H5 > H6 Value-added Service Capabilities H8 H1 > H2 H11 H1 & H2 > H3 & H4
Matching Capabilities to Strategies Strategy Cost Leadership Differentiation Low Cost Capabilities (Processes) Poor Performance Good Performance 28% 32% Capabilities Differentiation Capabilities (Value-Added Services) Poor Performance Good Performance 27% 13%
Overview of Corporate Strategy Miles and Snow Typologies Porter’s Generic Strategies Barney’s Resource-Based Theory Distinctive Capabilities Matching Strategy and Capabilities Corporate Culture Country Culture
Corporate Culture Culture the sum total of the attainments and learned behavior patterns of any specific period, race, or people, regarded as expressing a traditional way of life subject to gradual but continuous modification by succeeding generations. Corporate culture is the collection of learned and shared values and beliefs that create a common identity for members of an organization. Corporate Culture is an element of the firm composed of sets of values which should be managed by the organization in its efforts to achieve the goals of environmental adaptation and constituency satisfaction.
Dimensions of Corporate Cultural Management Style: Organic vs Mechanistic Organizational Form: Flexible vs Rigid Managerial Focus: Internal vs External Managerial Targets: Stable Markets vs Flexible Markets
CultureTypes Organic Management Style Organizational Flexibility Internal Focus Stable Market External Focus Flexible Market Mechanistic Management Style Organizational Stability
CultureTypes Organic Management Style Organizational Flexibility The Clan Internal Orientation Organic Management Emphasizes Flexibility Stable Market Position Adhocracy External Orientation Organic Management Emphasizes Flexibility Flexible Market Position Internal Focus Stable Market External Focus Flexible Market Hierarchy Internal Orientation Mechanistic Management Emphasizes Control Stable Market Position The Market Type External Orientation Mechanistic Management Emphasizes Control Flexible Market Position Mechanistic Management Style Organizational Stability
Miles and Snow Strategic Typologies Defenders Analyzers Reactors Prospectors
CultureTypes Organic Management Style Organizational Flexibility The Clan Strategy? Adhocracy Strategy? Internal Focus Stable Market External Focus Flexible Market Hierarchy Strategy? The Market Type Strategy? Mechanistic Management Style Organizational Stability
CultureTypes Organic Management Style Organizational Flexibility The Clan Reactors? Adhocracy Prospectors? Internal Focus Stable Market External Focus Flexible Market Hierarchy Defenders? The Market Type Analyzers? Mechanistic Management Style Organizational Stability
Model: Standardized Coefficients Coefficients (B) Std. Error (Beta) T-ValueP-Value (Constant) 96.788 0.589 164.1910.000 Prospect-2.779 1.007-0.238 -2.759 0.007 Analyze-2.673 0.778 -0.300 -3.434 0.001 Revenue0.000 0.000 -0.190 -2.277 0.025 Match M&S -2.068 0.827 -0.215 -2.501 0.014 FRH* 2.163 0.917 0.192 2.357 0.020 a Dependent Variable: Operating Ratio * Dummy for Flatbed, Reefer, Household Goods; Normal state was TL; Dummy for LTL was not significant.
Motor Carrier Operating Ratios • STRATEGY • Reactor Prospector Defender Analyzer • Clan 99.0 95.8 95.7 93.0 • CULTURE Adhocracy 96.3 90.9 98.1 94.5 • Hierarchy 96.8 93.0 94.7 93.4 • Market 97.5 94.0 95.3 92.1 • Mean Unmatched 96.9 94.3 96.4 93.6 • Matched in Bold 99.0 90.9 94.7 92.1
Motor Carrier Operating Ratios % Matched N% Not Matched % Matched N% Not Matched Clan/ReactorAdhocracy/Prospector Sums 299.01090.912 3196.92294.3 53 1794.7892.1 25 23 96.41893.6 41 73 58 Total: 131 131 Hierarchy/Defender Market/Analyzer
Overview of Corporate Strategy Miles and Snow Typologies Porter’s Generic Strategies Barney’s Resource-Based Theory Distinctive Capabilities Matching Strategy and Capabilities Corporate Culture Country Culture
Key Sources of Cultural Difference Power Distance Uncertainty Avoidance Individualism Assertiveness Level of Context Polychronic/Monochronic Time Face (in Asia)
Power Distances by Country Country Power Scale
Uncertainty Avoidance by Country Uncertainty Avoidance Scale
Individualism by Country Individualism Scale
Assertiveness by Country Assertiveness Scale
Matching Corporate and Country Cultures Low Power Distance Monochronic Polychronic High Power Distance
Matching Corporate and Country Cultures Low Power Distance Clan Adhocracy Monochronic Polychronic Hierarchy Market Type High Power Distance
Matching Corporate and Country Cultures Low Uncertainty Avoidance Monochronic Polychronic High Uncertainty Avoidance
Matching Corporate and Country Cultures Low Uncertainty Avoidance Clan Adhocracy Monochronic Polychronic Hierarchy Market Type High Uncertainty Avoidance