Download
1 / 23
230 likes | 254 Views
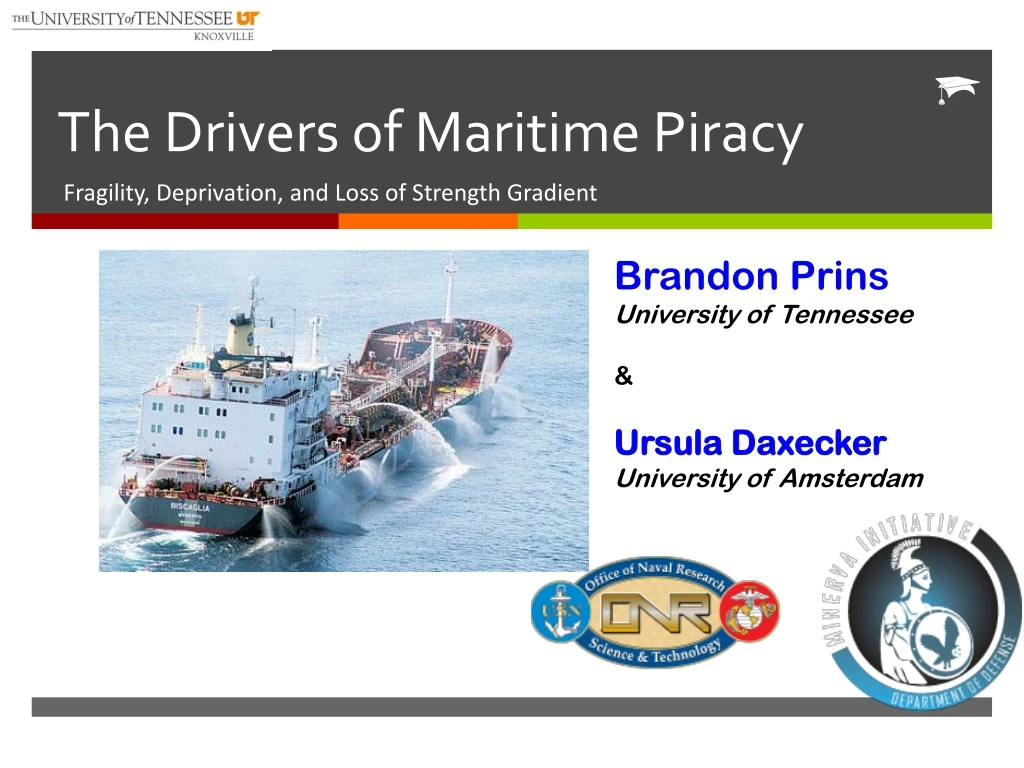
The Drivers of Maritime Piracy . Fragility, Deprivation, and Loss of Strength Gradient. Brandon Prins University of Tennessee & Ursula Daxecker University of Amsterdam. Heat Map of Piracy Incidents . ASAM 1985-2013. Overall Objectives of Research Project.

E N D
The Drivers of Maritime Piracy Fragility, Deprivation, and Loss of Strength Gradient Brandon Prins University of Tennessee & Ursula Daxecker University of Amsterdam
Heat Map of Piracy Incidents ASAM 1985-2013
Overall Objectives of Research Project • Build a theoretical model of maritime piracy • Existing research concentrates on state fragility and economic deprivation as drivers of piracy • We theorize that the effects of both factors are conditioned by distance (loss of strength gradient, which is defined as the ability of governments to enforce order over distance) • Our project will explore distance from several different angles • Geographic • Economic • Cultural • Operationalize loss of strength gradient • We need measures of critical factors affecting maritime piracy (fragility, deprivation, distance) • Geo-code all piracy incidents • Reconcile the various datasets that currently exist on maritime piracy • Build Database on Pirate Organizations in 4 or 5 countries • Use theoretical model to build country-level & sub-national (for several countries) risk indices • Forecast piracy events at the country and sub-country levels of analysis • Build a web-based portal to access data and map piracy incidents
How Research Maps into MINERVA Topic • MINERVA Topic 3 Subtopic D: • Theories of Power & Deterrence: Beyond Conventional Deterrence • Our research provides new thinking on the drivers of maritime piracy drawing on Ken Boulding’s pivotal work on loss of strength gradient. LSG has been applied (in a limited way) to insurgency, but we think the concept also has leverage in explaining maritime piracy, location of piracy, and positioning of pirate organizations • Our theoretical model connects both opportunity and the threat of punishment (deterrence) to maritime piracy. • We model strategic behavior on the part of pirates and governments • Research also has implications for Topic 4: Emerging Topics in Conflict and Security
How Research Advances Current Theory • LSG, or the interactive relationship between distance and standard correlates of maritime piracy, provides leverage in explaining piracy and advances current theory • Our research will extend micro-level analyses of piracy beyond Somalia • We reconcile various databases on piracy and test our theoretical model on different data sources • We use new modeling tools that incorporate binomial distributions, event count estimators, and spatial statistics to better understand piracy. • Apply new approaches to forecasting events that should aid in establishing a valid risk index for maritime piracy • Build several databases that will be available to researchers • GPI – Global Piracy Incidents Database • MPO – Mapping Pirate Organizations Database • MPELD – Maritime Piracy Event Location Database
Research in Progress • Initial/Preliminary Work by PIs • Forthcoming manuscripts in Journal of Conflict Resolution, Foreign Policy Analysis, and SAIS Review • Preliminary LSG paper will be presented at special (invite only) workshop on forecasting methods at ISA meeting in Toronto in March 2014 • Panel Proposal for EPSA 2014 • Title: Theoretical and Empirical Advances in the Study of Maritime Piracy • We have paper that examines the relationship between state fragility and the distance to piracy incidents in territorial waters. We expect piracy to occur closer to a country’s power center as state fragility increases. • Future Work • Effect of piracy on trade flows • Connections between insurgency and piracy • Disaggregate piracy incidents by month and examine in several countries, such as Nigeria, Indonesia, Malaysia, etc. • Use hierarchical modeling tools to explore drivers of maritime piracy. • Examine youth bulges in piracy-prone countries • Acquire shipping data to get a better sense of whether maritime traffic in and out of a country’s ports is related to piracy. Currently our regional trade measure is significantly related to piracy, but a shipping data would provide a better measure of opportunity.
Preliminary Analyses of Maritime Piracy • Following slides begin analyses of: • Distance • Micro-level analyses of piracy • Beginnings of hierarchical model of piracy • Building country and within country databases • Building MPO database • LSG and piracy
Distance to Piracy from Capital Cities We see that as state strength increases, piracy moves farther away from capital cities. The same relationship occurs with a measure of government corruption. Piracy Data Source: IMB
Correlates of Maritime Piracy State Weakness Economic Deprivation
Extractive Capacity – Distance Interaction • Figures show that the effect of state weakness on piracy increases with increasing distance between capital and coastline • Weak states cannot project power over territory effectively and so pirates strategically locate themselves outside of a government’s political reach
Accuracy of Predicted Risk Index 2013 True Piracy Risk 2013 Predicted Piracy Risk 2013 We our structural loss-of-strength-gradient model to forecast piracy in 2013. The model tends to over-predict more than under-predict and generally captures the most at-risk countries. The table on the next slide shows the cases we correct predict and the ones that we miss. Grey boxes show correct predictions.
Prediction Accuracy for High-and Moderate Risk Countries, Extractive Capacity 2013
Global Piracy and Predictions The figure below shows true global piracy counts by year (spikes) and our model prediction (dashed line). Our model predicts 248 piracy incidents in 2014. Currently IMB reports approximately 45.
Armed Conflict in Somalia and Proximity to Pirate Hubs • The map shows geo-coded piracy data and geo-coded armed conflict data • There may be a connection between armed insurgency and maritime piracy. • We have looked and the temporal relationship between armed conflict and piracy and find that piracy does appear to increase in the year after armed conflicts • Piracy may help fund insurgent movements in some countries
Disaggregating Piracy: Nigeria • Has substantial piracy • Comparison with Somalia • Sub-Saharan Africa DOD Project
Explaining & Predicting Nigerian Piracy Piracy Data Source: IMB
Nigerian Piracy, 1985-2013 Piracy Data Source: ASAM
Monthly Piracy - Somalia & Nigeria • Weather in Greater Gulf of Aden • Northeast Monsoon, December to March. • Transition season, April and May. • Southwest Monsoon, June to September. • Transition season, October and November. Piracy Data Source: IMB
Predicted vs. Actual Piracy IncidentsOut of Sample - 2011-2013
The End Questions? Comments?