Download
1 / 54
540 likes | 540 Views
This workshop will focus on housing census data and its implications for disaster mitigation in India. Topics will include administrative divisions, seismic zones, natural disasters, and the effect of disasters on the Indian population. Participants will learn how to utilize housing census data for disaster management.

E N D
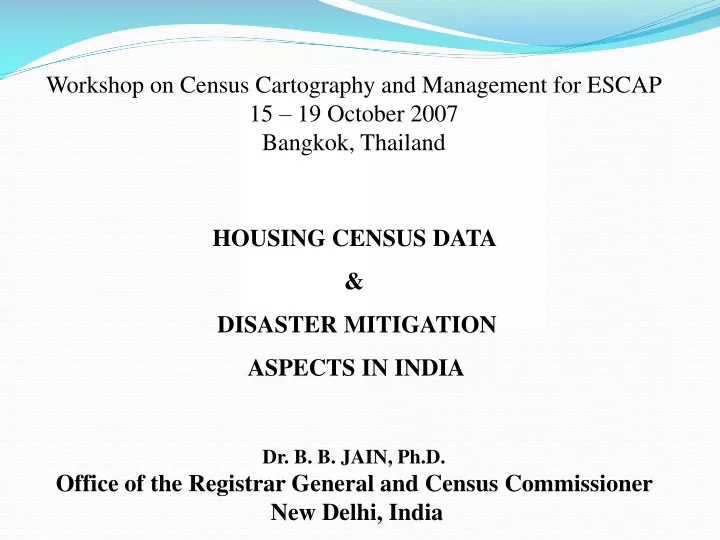
Workshop on Census Cartography and Management for ESCAP 15 – 19 October 2007 Bangkok, Thailand HOUSING CENSUS DATA & DISASTER MITIGATION ASPECTS IN INDIA Dr. B. B. JAIN, Ph.D. Office of the Registrar General and Census Commissioner New Delhi, India
ADMINISTRATIVE DIVISIONS : FACTS & FIGURES • STATES: 35 (28 States and 7 Union territories) • DISTRICTS: 593 • SUBDISTRICTS: 5,463 • TOWNS: 5,161 • C D BLOCKS: 6,404 • VILLAGES: 6.39 Lakh (44,856 Uninhabited) • AREA :3.28 Million Sq.Kms • 2.4 % of World Surface Area. • 16.9 % of World Population.
Administrative Setup (Country) INDIA States (35) Districts (593) Sub-district (5,463) C D Block (6,406) Town (5161) Village (0.6 million) Ward
SEISMIC ZONES IN INDIA Zone V: Covers the areas liable to seismic intensity IX and above on Modified Mercalli Intensity Scale. This is the most severe seismic zone and is referred here as Very High Damage Risk Zone. Zone IV: Gives the area liable to MM VIII. This, zone is second in severity to zone V. This is referred here as High Damage Risk Zone. Zone III: The associated intensity is MM VII. This is termed here as Moderate Damage Risk Zone. Zone II: The probable intensity is MM VI. This zone is referred to as Low Damage Risk Zone. ZoneI: Here the maximum intensity is estimated as MM V or less. This zone is termed here as Very Low Damage Risk Zone.
NATURAL DISASTERS : EFFECT IN INDIA Indian Subcontinent is one of the world’s most disaster prone areas 1.Earthquake: 54% area vulnerable to Earthquakes One million houses damaged annually + human,social,other losses 12%of land is liable to severe earthquake MSK IX 18%land is liable to MSK VIII 25%land liable to MSK VII 2.Floods: 12% area of the country is prone to floods which means 40 million Hectares land area are prone to floods and annually on an average 8 million is affected 3.Wind and Cyclone Hazards: 8% of land prone to cyclones affect by both the Bay of Bengal and Arabian Sea. 4.Land Slides: Areas of Himalayas, North-eastern Region and Western Ghats prone of land slides. 5.Drought: 68% of the country is prone to drought in varying degrees.
Indian agriculture is heavily dependent on the monsoon as a source of water. In some parts of India, the failure of the monsoons result in water shortages, resulting in below-average crop yields.This is particularly true of major drought-prone regions such as southern and eastern Maharashtra, northern Karnataka, Andhra Pradesh, Orissa, Gujarat, and Rajasthan. In the past, droughts have periodically led to major Indian famines, including the Bengal famine of 1770, in which up to one third of the population in affected areas died; the 1876–1877 famine, in which over five million people died; the 1899 famine, in which over 4.5 million died; and the Bengal famine of 1943, in which over five million died from starvation and famine-related illnesses. NATURAL DISASTERS : EFFECT IN INDIA
Indian Census – Brief background • First synchronous census held in 1881 • Census 2001 was the 14th in this uninterrupted series • Adopted extended de-facto method (or enumerating persons normally residing in the household during the enumeration period) • Census held in two phases: • House-listing Operations …(April to June 2000) • Population Enumeration …(9th to 28th February 2001)
Indian Census – Brief background • Unit of enumeration in Census is the Enumeration Block (EB) allotted to an Enumerator • Curved out on the basis of population size, an EB comprises of about 120 – 150 households or about 500 to 750 persons • 2 million Enumerators were deployed for 2001 Census. Mostly primary school teachers.
The final results of the House listing Operations 2001 were released in April, 2003 which provided valuable information on the housing stock, amenities and assets available to the household. House-listing data is available in ‘Tables on Houses, Household Amenities and Assets by India and States’. This data is also available in hard copy and electronic format for India and all the States/Union territories at district, sub-district and town level. The House-listing data is immensely useful to the Disaster Managers, Policy makers, Planners, Administrators to improve the quality of life in vulnerable areas.
Census of India – 2001:PopulationFigures at a Glance Population: 1,028,737,436 Males: 532,223,090 (51.7 %) Rural Males: 381,668,992 (37.1 %); Urban Males: 150,554,098 (14.6 %) Females: 496,514,346 (48.3 %) Rural Females: 360,948,755 (35.1 %); Urban Females: 135,565,591 (13.2 %) Child Population (age 0–6years): 163,819,614 (15.9 % of total population) Male Children : 84,999,203 (8.3 % of total population) Female Children : 78,820,411 (7.7 % of total population) Literate Persons: 560,687,797 (64.8 %) Literate Males: 336,533,716 (75.3 %) Literate Females: 224,154,081 (53.7 %)
HOUSING CENSUS DATA in Tables, INDIA,2001 H-2 Distribution of census houses used as residence and residence-cum-other use by their condition H-2 Appendix Distribution of households by the condition of census houses occupied by them H-3A Distribution of census houses by predominant material of roof H-3B Distribution of census houses by predominant material of wall
H-3C Distribution of census houses by predominant material of floor H-3A Appendix Distribution of households living in census houses by predominant material of roof H-3B Appendix Distribution of households living in census houses by predominant material of wall H-3C Appendix Distribution of households living in census houses by predominant material of floor
H-11 Distribution of households by availability of separate kitchen and type of fuel used for cooking H-12 Distribution of households by source and location of drinking water and availability of electricity and latrine H-12 A (E) Distribution of households classified by source and location of drinking water and availability of electricity and latrine
H-12 B (E) Households and distribution of 1000 population by availability of electricity and toilet facilities and ownership status of house occupied H-4 Distribution of census houses used as residence and residence-cum-other use by their type of structure H-4 Appendix Distribution of households by type of census houses occupied H-5 Distribution of households by size and number of dwelling rooms
H-6 Distribution of households by ownership status of the census houses occupied by them and number of dwelling rooms H-6A (E) Distribution of households by ownership status of census houses, size of the household and number of dwelling rooms
H-7 Distribution of households by number of married couples in a household and number of dwelling rooms, total number of married couples and number of married couples having independent sleeping rooms H-7A (E) Distribution of married couples and married couples having independent sleeping room by number of dwelling rooms available to the households in which they live and by number of married couples
H-8 Distribution of households by source of drinking water and its location H-9 Distribution of households by source of lighting H-10 Distribution of households by availability of bathroom & type of latrine within the house and type of drainage connectivity for waste water outlet
H-11 Distribution of households by availability of separate kitchen and type of fuel used for cooking . H-12 Distribution of households by source and location of drinking water and availability of electricity and latrine H-12 A (E) Distribution of households classified by source and location of drinking water and availability of electricity and latrine . H-13 Number of households availing banking services and number of households having each of the specified asset
Mapping Exercises: • Aims to provide a pictorial base to the planning process especially to the semi literate population . Social Mapping: Location of habitat, natural topography, number of pucca (burnt bricks) and kuchha (mud etc.) houses, Other common infrastructures(eg. Safe Shelter worship place,health centre, play ground etc. Resource Mapping: Locally available resources and assets for use during disasters.
Mapping Exercises: • 1.SOCIAL MAPPING • LOCATION OF THE HABITAT WITH RESPECT TO NATURAL TOPOGRAPHY • NUMBER of PUCCA and KACCHA HOUSES • 2.RESOURSE MAPPING • 3.VULNERABILITY MAPPING • Household Wise Vulnerable Groups • Vulnerable Houses And Defunct Infrastructure • Low Lying Areas Prone To Floods • Landslide Prone Areas • Location Of Hazardous Industries/Electrical Installations/ Tall Weak Structures – Buildings ,etc. • Narrow Roads • 4.SAFE AND ALTERNATE ROUTE MAPPING
NATIONAL DISASTER MANAGEMENT : INDIA • MINISTRY OF HOME AFFAIRS • NATIONAL CRISIS MANAGEMENT COMMITTEE(NCMC) • NATIONAL& STATE DISASTER MANAGEMENT AUTHORITY • NATIONAL INSTITUTE OF DISASTER MANAGEMENT • IMD , CWC, DOS,(NRSA) • NATIONAL DISASTER RESPONSE
Housing Census Data & Maps ofTamil Nadu State in India(Tsunami Effected)
HOUSING PROFILE :TAMIL NADU (India) CENSUS HOUSES AND THE USES TO WHICH THEY ARE PUT
Tamil Nadu (India) HOUSEHOLDS LIVING IN CENSUS HOUSES BY PREDOMINANT MATERIAL OF ROOF
ASSETS AVAILABLE IN RURAL AREAS TAMIL NADU,2001
RECOMMENDATIONS • The maps of relief, contours, physiography, geological structure and housing conditions, material used in houses are digitized separately into polygon coverages using PC Arc/Info. Census data on housing are shown on map using Arc GIS software. • Helpful in identifying the comparative position of housing stock prone to disaster.