Download
1 / 16
160 likes | 309 Views
Oklahoma Agricultural Land Value Update. Roger Sahs, Extension Specialist OSU Department of Agricultural Economics. West-Northwest Tracts 171 Size 250 $/Acre $1310 % Chg +5.2. North Central Tracts 112 Size 170 $/Acre $1608

E N D
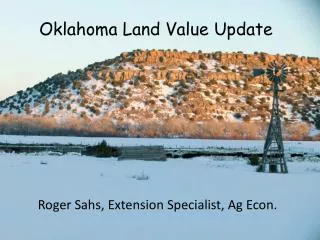
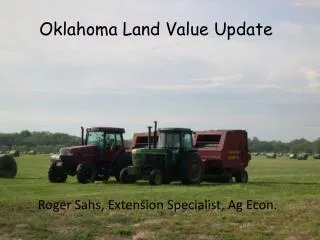
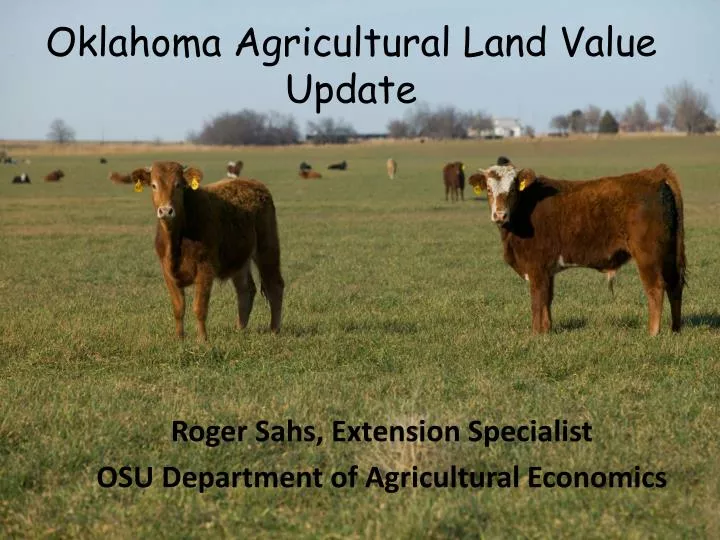
Oklahoma Agricultural Land Value Update Roger Sahs, Extension Specialist OSU Department of Agricultural Economics
West-Northwest Tracts 171 Size 250 $/Acre $1310 • % Chg +5.2 North Central Tracts 112 Size 170 $/Acre $1608 • % Chg +6.5 Northeast Tracts 286 Size 284 $/Acre $1634 • % Chg -3.0 East-Northeast Tracts 33 Size 195 $/Acre $1828 • % Chg -6.0 Panhandle Tracts 39 Size 595 $/Acre $809 % Chg +22.1 Southeast Tracts 205 Size 214 $/Acre $1548 • % Chg +4.6 State Averages Tracts 1114 Size 257 $/Acre $1468 % Chg +2.1 Southwest Tracts 167 Size 214 $/Acre $1172 • % Chg +12.6 South Central Tracts 101 Size 237 $/Acre $1574 • % Chg -2.2 OK Land Values by Region, 2012
Recent Trends in Oklahoma Land Values Source: www.agecon.okstate.edu/oklandvalues
Oklahoma Cropland vs Pastureland Prices Upward but not steady climb in values. “Boom to Bust” was only 30 years ago. Major increase in values in recent years. Source: www.agecon.okstate.edu/oklandvalues
Oklahoma Cropland and Pastureland Prices Nominal vs Inflation Adjusted (base year 2000) Cropland Pasture Source: www.agecon.okstate.edu/oklandvalues
1973-1975 Average Value Tracts >= 40 Acres and <= $3000/Acre Source: www.agecon.okstate.edu/oklandvalues
2010-2012 Average Value Tracts >= 40 Acres and <= $6000/Acre Source: www.agecon.okstate.edu/oklandvalues
Land prices going ahead… • Changes in the environment • Farm Bill • Domestic economy • Global economy • Elections/policy • Interest rates • Recreational uses • Wildlife habitat, wildlife population • Development uses • Population growth • Per capita income • Agriculture • Input prices • Cattle, wheat/feedgrain prices • Yields • Efficiency, productivity • Continued drought
Key Land drivers looking ahead… • Recent commodity prices and farm incomes • Interest rate levels • Financial health of current buyers
Oklahoma Wheat Price and Net Farm Income $/bushel $ in Billions Source: ERS and NASS
Financial Strength 2013 Balance Sheet of the U.S. Farming Sector (forecast) Total Farm Assets: Assets: $3.010 trillion Total Farm Debt: $308 Billion Total Farm Equity: Equity: $2.702 trillion Debt‐to‐Equity Ratio: 11.4 Low! Debt‐to‐Asset Ratio: 10.2 Low! Bottom-Line: Strong financial fundamentals for the Ag sector. Minimal Debt Leverage and Low Financial Stress! Source: Economic Research Service, August 2013
Resources • Agecon.okstate.edu/oklandvalues • Kansas City Federal Reserve Bank • http://www.kc.frb.org/ • Choose RESEARCH & DATA, then Economic Review or Agricultural Credit Survey • USDA Ag Land Value Data and Reports • http://www.nass.usda.gov/Charts_and_Maps/Land_Values_and_Cash_Rents/index.asp