Download
1 / 28
380 likes | 1.68k Views
Instrumental Analysis. Instrumental Analysis. The course is designed to introduce the student to modern methods of instrumental analysis

E N D
Instrumental Analysis • The course is designed to introduce the student to modern methods of instrumental analysis • In modern analytical chemistry. The focus of the course is in trace analysis, and therefore methods for the identification, separation and quantitation of trace substances will be described.
Scope and Relevancy of Instrumental Analysis • Approximately 66% of all products and services delivered in the US rely on chemical analyses of one sort or another • Approximately 250,000,000 chemical determinations are performed in the US each day • NIST, 1991, from Managing the Modern Laboratory, 1(1), 1995, 1-9.
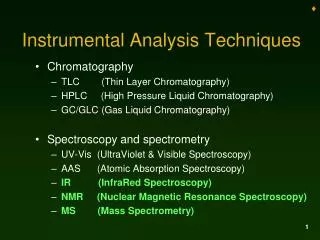
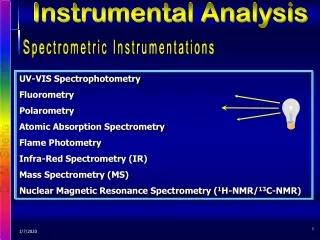
Instrumental Methods • Involve interactions of analyte with EMR • Radiant energy is either produced by the analyte (eg., Auger) or changes in EMR are brought about by its interaction with the sample (eg., NMR) • Other methods include measurement of electrical properties (eg., potentiometry)
Instruments • Converts information stored in the physical or chemical characteristics of the analyte into useful information • Require a source of energy to stimulate measurable response from analyte • Data domains • Methods of encoding information electrically • Nonelectrical domains • Electrical domains • Analog, Time, Digital
Detector • Device that indicates a change in one variable in its environment (eg., pressure, temp, particles) • Can be mechanical, electrical, or chemical • Sensor • Analytical device capable of monitoring specific chemical species continuously and reversibly • Transducer • Devices that convert information in nonelectrical domains to electrical domains and the converse
Calibration Methods Chapter 5
Method Validation • Specificity • Linearity • Accuracy • Precision • Range • Limits of Detection and Quantitation
Method Validation - Specificity • How well an analytical method distinguishes the analyte from everything else in the sample. • Baseline separation vs. time time
Method Validation- Linearity • How well a calibration curve follows a straight line. • R2 (Square of the correlation coefficient)
Method Validation- LOD and LOQ Sensitivity • Limit of detection (LOD) – “the lowest content that can be measured with reasonable statistical certainty.” • Limit of quantitative measurement (LOQ) – “the lowest concentration of an analyte that can be determined with acceptable precision (repeatability) and accuracy under the stated conditions of the test.” • How low can you go?
Limit of Detection (LOD) • Typically 3 times the signal-to-noise (based on standard deviation of the noise)
Limit of Linear Response (LOL) • Point of saturation for an instrument detector so that higher amounts of analyte do not produce a linear response in signal.
Useful Range of an Analytical Method Dynamic range LOL (Limit of linearity) signall LOD = 3x SD of blank LOQ = 10x SD of blank LOQ (Limit of quantitation) concentration LOD (Limit of detection)
Method Validation- Linearity signall Slope is related to the sensitivity concentration
Method Validation- Accuracy and Precision Precision - reproducibility • Accuracy – nearness to the truth • Compare results from more than one analytical technique • Analyze a blank spiked with known amounts of analyte.
Method Validation- LOD and LOQ • Detection limit (lower limit of detection – smallest quantity of analyte that is “statistically” different from the blank. • HOW TO: • Measure signal from n replicate samples (n > 7) • Compute the standard deviation of the measurments • Signal detection limit: ydl = yblank + 3s • ysample - yblank = m . sample concentration • Detection limit: 3s/m • Lower limit of quantitation (LOQ) : 10s/m Example: sample concentrations: 5.0, 5.0, 5.2, 4.2, 4.6, 6.0, 4.9 nA Blanks: 1.4, 2.2, 1.7, 0.9, 0.4, 1.5, 0.7 nA The slope of the calibration curve for high conc. m= 0.229 nA/mM What is the signal detection limit and the minimum detectable concentration? What is the lower limit of quantitation?
Standard Addition • Standard addition is a method to determine the amount of analyte in an unknown. • In standard addition, known quantities of analyte are added to an unknown. • We determine the analyte concentration from the increase in signal. • Standard addition is often used when the sample is unknown or complex and when species other than the analyte affect the signal. • The matrix is everything in the sample other than the analyte and its affect on the response is called the matrix effect
The Matrix Effect • The matrix effect problem occurs when the unknown sample contains many impurities. • If impurities present in the unknown interact with the analyte to change the instrumental response or themselves produce an instrumental response, then a calibration curve based on pure analyte samples will give an incorrect determination
Calibration Curve for Perchlorate with Different Matrices Perchlorate (ClO4-) in drinking water affects production of thyroid hormone. ClO4- is usually detected by mass spectrometry (Ch. 22), but the response of the analyte is affected by other species, so you can see the response of calibration standards is very different from real samples.
Calculation of Standard Addition • The formula for a standard addition is: • [X] is the concentration of analyte in the initial (i) and final (f) solutions, [S] is the concentration of standard in the final solution, and I is the response of the detector to each solution. • But, • If we express the diluted concentration of analyte in terms of the original concentration, we can solve the problem because we know everything else.
Standard Addition Example • Serum containing Na+ gave a signal of 4.27 mv in an atomic emission analysis. 5.00 mL of 2.08 M NaCl were added to 95.0 mL of serum. The spiked serum gave a signal of 7.98 mV. How much Na+ was in the original sample?
Internal Standards • An internal standard is a known amount of a compound, different from the analyte, added to the unknown sample. • Internal standards are used when the detector response varies slightly from run to run because of hard to control parameters. • e.g. Flow rate in a chromatograph • But even if absolute response varies, as long as the relative response of analyte and standard is the same, we can find the analyte concentration.
Response Factors For an internal standard, we prepare a mixture with a known amount of analyte and standard. The detector usually has a different response for each species, so we determine a response factor for the analyte: [X] and [S] are the concentrations of analyte and standard after they have been mixed together.
Internal Standard Example • In an experiment, a solution containing 0.0837 M Na+ and 0.0666 M K+ gave chromatographic peaks of 423 and 347 (arbitrary units) respectively. To analyze the unknown, 10.0 mL of 0.146 M K+ were added to 10.0 mL of unknown, and diluted to 25.0 mL with a volumetric flask. The peaks measured 553 and 582 units respectively. What is [Na+] in the unknown? • First find the response factor, F
Internal Standard Example (Cont.) • Now, what is the concentration of K+ in the mixture of unknown and standard? • Now, you know the response factor, F, and you know how much standard, K+ is in the mixture, so we can find the concentration of Na+ in the mixture. • Na+ unknown was diluted in the mixture by K+, so the Na+ concentration in the unknown was: