Download
1 / 22
220 likes | 374 Views
Report of the Facts & Figures Committee Tore Forsmo Chairman. Committee Members. Paul BUYL (Belgium) Cédric CHARPENTIER (France) Jim CRAIG (USA) Andrea CUPIDO (Italy) Tore FORSMO (Norway) (Chairman) Pamela FROOD (UK/IUA) Patrizia KERN (Switzerland) Jens SCHILDKNECHT (Germany)

E N D
Report of the Facts & Figures Committee Tore Forsmo Chairman
Committee Members • Paul BUYL (Belgium) • Cédric CHARPENTIER (France) • Jim CRAIG (USA) • Andrea CUPIDO (Italy) • Tore FORSMO (Norway) (Chairman) • Pamela FROOD (UK/IUA) • Patrizia KERN (Switzerland) • Jens SCHILDKNECHT (Germany) • Astrid SELTMANN (Norway) (Secretary) • Simon STONEHOUSE (UK/Lloyd’s)
Global Shipping Market Trends Facts & Figures Committee Tore Forsmo Managing Director The Central Union of Marine Underwriters, Oslo, Norway Thanks also to F&F Committee Members Cédric Charpentier and Simon Stonehouse
World Merchant Fleet by type of ship of 300gt and overAs at January 1st 2007 – number of ships in share of the World Reported Fleet, growth rate 2002-2007 (%) and average age WORLD REPORTED FLEET Total number : 42,872 ships increased by + 9.6 % on the period Average age : 19.1 years Ro-Ro cargo 3.0% (+12.5%) Special Ships 3.1% Reefer ships 2.6% (+17.7%) (-12.2%) Oil Tankers 19.1% (+12.1%) 22.1 19.7 19.2 17.1 General cargo 31.4% Chemical tankers 3.2% (-6.3%) (+7.3%) 23.3 18.7 16.3 Liquefied gas 2.9% 15.8 (+11.8%) 22.8 10.8 Bulk carriers 15.8% (+14.8%) Passengers 9.6% (+7.9%) Ore/Bulk/Oil 0.2% Container ships 9.1% (-46.2%) (+42.4%) Source: Indicators issued from various sources such as ISL Bremen for World fleet and trading figures and Clarkson Research Studies for shipbuilding and scrapped vessels.
World Merchant Reported Fleet by type of ships 300gt and overAs at January 1st, 2007 – Deadweight and growth rate 2001-2007 100% 86.5% 1,009,523 1,000,000 75% 45.8% 800,000 50% 35.9% 29.6% 29.8% 24.7% 15.2% 13.7% 25% 600,000 -0.9% -4.9% -9.8% 0% 374,454 357,568 400,000 -25% 200,000 -59.6% -50% 128,174 74,133 26,857 12,652 10,008 6,952 6,585 6,062 6,078 -75% Oil Tankers Chemical tankers Liquefied gas Bulk carriers Ore/Bulk/Oil Container ships Passengers General cargo Reefer ships Ro-Ro cargo Special Ships Total 1,000dwt in 2007 Growth rate 2001/ 2007 Source: Indicators issued from various sources such as ISL Bremen for World fleet and trading figures and Clarkson Research Studies for shipbuilding and scrapped vessels.
World Merchant Fleet of ships of 300gt and overEvolution of the growth rates (GT, DWT, and Number of ships) between 1995 and 2007 70% 1,009,524 mDWT 60% (+ 56.4%) 50% 685,738 mGT (+ 48.1%) 40% 30% 778,758 mDWT (+ 18.8%) 42,872 ships 20% (+ 18.3%) 520,913 mGT (+ 14.2%) 10% 39,008 ships (+ 7.6%) 0% 1995 1996 1997 1998 1999 2000 2001 2002 2003 2004 2005 2006 2007 Source: Indicators issued from various sources such as ISL Bremen for World fleet and trading figures and Clarkson Research Studies for shipbuilding and scrapped vessels.
World Merchant Fleet by main types ofship of 300gt and overEvolution of the number of ships in shares (%) of the world fleet 97–07, Growth rate in 2006 as at 1st January 2007 Source: Indicators issued from various sources such as ISL Bremen for World fleet and trading figures and Clarkson Research Studies for shipbuilding and scrapped vessels.
World Merchant Reported Fleet by National and Foreign FlagAs at January 1st, 2007 – thousand DWT and number of ships Ships > 1,000 GT 1,000dwt 1,200,000 1,000,000 17,058 800,000 15,668 14,480 600,000 13,840 13,342 Foreign Flag (dwt) 13,305 400,000 13,039 200,000 12,707 12,916 National Flag (dwt) 12,905 12,646 12,462 0 2002 2003 2004 2005 2006 2007 Total Units in the : Reported Fleet 26,247 26,486 28,375 26,221 26,942 30,097 Not Reported Fleet 4,174 3,909 3,228 4,117 3,567 3,686 Total World Fleet 29,933 30,395 30,603 30,851 33,325 31,942 Source: Indicators issued from various sources such as ISL Bremen for World fleet and trading figures and Clarkson Research Studies for shipbuilding and scrapped vessels.
World Merchant Fleet – Top 10 Countries Source: Indicators issued from various sources such as ISL Bremen for World fleet and trading figures and Clarkson Research Studies for shipbuilding and scrapped vessels.
World Merchant Fleet – Top 10 Countries by National (NF) and Foreign Flags (FF)As at January 1st, 2007 Ships > 1,000 GT 1,000 DWT Years 150,000 35 Average Age NF : 17.2 years 30 Average Age FF : 13.2 years 25 Top Ten Countries Fleet Average Age : 15.5 years 100,000 20 15 50,000 10 5 0 0 UK USA JAPAN GREECE NORWAY GERMANY SINGAPORE CHINA, PR of HONG-KONG KOREA, Rep of 1,000 DWT NF 1,000 DWT FF Average Age NF Average Age FF Source: Indicators issued from various sources such as ISL Bremen for World fleet and trading figures and Clarkson Research Studies for shipbuilding and scrapped vessels.
Orderbook Evolution by type of shipin million DWT General cargo 9.2 334.0 350 Others 5.5 Container 58.1 300 241.8 LNG/LPG 17.2 220.0 250 176.7 Bulk Carriers 97.7 200 112.3 115.6 150 Tankers 146.3 100 50 0 2001 2002 2003 2004 2005 2006 Tankers >=1,000dwt Bulk Carriers >=10,000dwt LNG/LPG Carriers Container Vessels >=5,000dwt Others (of which Passenger Vessels >=1,000grt) General cargo (>= 300gt) Source: Indicators issued from various sources such as ISL Bremen for World fleet and trading figures and Clarkson Research Studies for shipbuilding and scrapped vessels.
World Shipbuilding – Shares of Deliveries Japan Europe Others Korea China Source: Clarkson Research Studies for shipbuilding and scrapped vessels.
Vessels on order by Country of Build@ August 2007 (Numbers) Total No 8,414 (2006- 5,653) Source: Clarkson Research Studies for shipbuilding and scrapped vessels.
Vessels on order by Country of Build@ August 2007 (DWT) Total 436.8 million DWT (2006 – 275.6m) Source: Clarkson Research Studies for shipbuilding and scrapped vessels.
Top Contracting Countries by Number of Vessels on Order (Aug 07) Source: Clarkson Research Studies for shipbuilding and scrapped vessels.
Top Contracting Countries by DWT of Vessels on Order (Aug 07) Source: Clarkson Research Studies for shipbuilding and scrapped vessels.
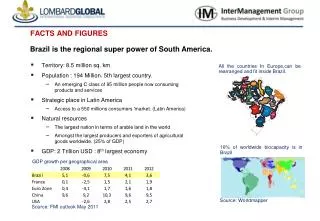
GDP 2006and GDP Growth Rate 02-06 14 000 + 9.5% 10 % GDP 2006 (billion USD) 12 000 Actual % GDP Growth (2002 - 2006) + 6.8% 10 000 + 6.1% 5 % 8 000 + 3.3% + 2.9% + 2.7% + 2.5% + 1.8% + 1.5% 6 000 + 0.9% + 0.6% 0 % 4 000 2 000 - -5 % China (1) India (1) Russian Spain USA Canada UK Japan France Germany Italy Federation (1) (1) % GDP growth for 2001-2005
Major trades Total World Trade 2,900 + 6 % Crude oil and oil products 7,000 + 5 % 2,400 + 2 % 6,000 1,900 + 7 % 5,000 1,400 4,000 900 1996 1997 1998 1999 2000 2001 2002 2003 2004 2005 2006 (*) World Seaborne Trade Volume Development 1996-2006 (in million tonnes) - Growth rate in 2006 The 4 main Dry Bulk Cargoes (Iron Ore, Coal, Grain, Bauxite/Alumina) Other Cargoes Total World Trade estimates (*) Source: Indicators issued from various sources such as ISL Bremen for World fleet and trading figures and Clarkson Research Studies for shipbuilding and scrapped vessels.
World Trade Values Development 1996-2006 (in million USD) – Growth rate in 2006 Oil & Dry Bulk 2,000,000 + 16.9 % + 27.1 % 1,500,000 + 15.7 % 10,000,000 1,000,000 8,000,000 500,000 6,000,000 + 14.5 % 4,000,000 - 1996 1997 1998 1999 2000 2001 2002 2003 2004 2005 2006 (*) Total World Trade & Other cargoes 12,000,000 Crude oil and oil products The 4 main Dry Bulk Cargoes (Iron Ore, Coal, Grain, Bauxite/Alumina) Other Cargoes Total World Trade (*) Source: Indicators issued from various sources such as ISL Bremen for World fleet and trading figures and Clarkson Research Studies for shipbuilding and scrapped vessels.
World Market Price Indices for Selected Commodities Annual Average (1993-2006) – Average in 2007 as at end of May (*) Source: Indicators issued from various sources such as ISL Bremen for World fleet and trading figures and Clarkson Research Studies for shipbuilding and scrapped vessels.
FREIGHT MARKET (indices) – YEARS 1995 to 2007 (January to May 2007) Index 1972 = 100 800 758.6 700 Time Charter Index (1 to 2 months) General Freight Index Grain Freight Index 600 Miscellaneous Freight Index 529.8 500 504.4 448.4 400 300 200 100 0 1997 1998 1999 2000 2001 2002 2003 2004 2005 2006 2007 Source: Indicators issued from various sources such as ISL Bremen for World fleet and trading figures, Clarkson Research Studies for shipbuilding and scrapped vessels and Maritime Research Inc., New Jersey for Freight Market indices.