Download
1 / 9
120 likes | 488 Views
GOOGLE FLU TRENDS. Sore throat? Sniffles?. Google it! Duh! During flu season, more people enter search queries concerning the flu. Each year 90 million American adults search web for info about specific illnesses = LOTS OF DATA

E N D
Sore throat? Sniffles? Google it! Duh! During flu season, more people enter search queries concerning the flu. Each year 90 million American adults search web for info about specific illnesses = LOTS OF DATA Importance: 250,000 - 500,000 deaths from respiratory illnesses worldwide.
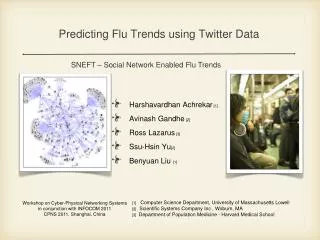
Previous Attempts Swedish website counted queries in order track flu activity. There was a strong correlation between frequency of search terms containing “flu” and “influenza” and virologic surveillance data These models look for a very limited number of queries.
Google’s Version Took 50 million of the most common search queries between 2003-2008 and did a weekly count for each state Normalized data by dividing count by total searches for the week (thereby getting a percentage)
Each of 50 million queries were tested for correlation with CDC data Ranked according from most to least correlated We want to estimate flu activity based on more then just a few queries
Google added top ranked queries together to see what number would yield the most accurate results. The magic number is 45
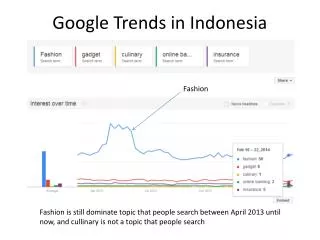
Previously unused data for flu season of 2007-2008 as a test set The mean correlation was 0.97 (ranged between 0.92 and 0.99)
Advantages Generate accurate estimates faster than CDC. CDC takes one to two weeks to process data and generate a flu activity report It takes Google one to two days to generate an estimate Faster estimates means that health officials can quickly direct resources to where the need is greatest
Future Expand Google Flu Trends to predict flu activity across the globe. Challenges: some countries do not have official historical data