Download

1 / 7
70 likes | 76 Views
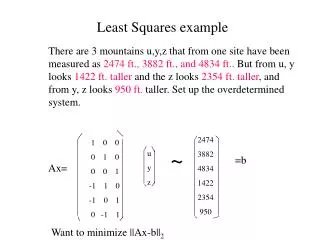
Estimated Weighted Least Squares. Profits and Market Structure for Highly Advertising Companies J.M. Vernon and R.E.M. Nourse (1973). “Profit Rates and Market Structure of Advertising Intensive Firms,” The Journal of Industrial Economics , Vol. 22, #1, pp. 1-20. Data Description.

E N D
Estimated Weighted Least Squares Profits and Market Structure for Highly Advertising Companies J.M. Vernon and R.E.M. Nourse (1973). “Profit Rates and Market Structure of Advertising Intensive Firms,” The Journal of Industrial Economics, Vol. 22, #1, pp. 1-20
Data Description • n = 57 Large Advertising Intensive Firms • Dependent Variable: Equity Profit (PE) (net income/shareholder equity) averaged over 1963-1968 • Independent Variables (Subset of the original paper’s): • DCR = 1 if firm’s average market Concentration Ratio ≥ 50, 0 otherwise (1 firm is in highly concentrated product areas) • AS = Average INDUSTRY Advertising/Sales Ratio • CAS = FIRM Advertising/Sales Ratio • LRSIZ = 1/ln(ASSETS) • SIZ = ASSETS (Used to estimate variance heterogeneity) • Heterogeneity Model (Larger firms ≈ many small firms):
Ordinary Least Squares Regression and Correlations While not all regression coefficients are significant, there is evidence that profits are higher for firms in highly concentrated markets, with high industry and firm advertising, and higher assets. (Barriers of entry)