Download
1 / 1
10 likes | 118 Views
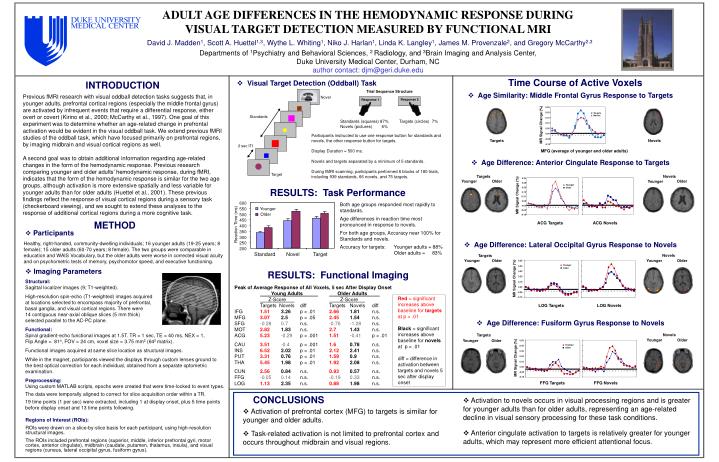
Novel. MR Signal Change (%). 0.25. 0.20. Targets. Novels. Standards. 0.15. 0.10. 0.05. 0.00. -5. -4. -3. -2. -1. 0. 1. 2. 3. 4. 5. 6. 7. 8. 9. 10. 11. 12. 13. -0.05. -0.10. 2 sec ITI. MFG (average of younger and older adults). Targets.

E N D
Novel MR Signal Change (%) 0.25 0.20 Targets Novels Standards 0.15 0.10 0.05 0.00 -5 -4 -3 -2 -1 0 1 2 3 4 5 6 7 8 9 10 11 12 13 -0.05 -0.10 2 sec ITI MFG (average of younger and older adults) Targets Trial Sequence Structure Younger Older Target Novels MR Signal Change (%) 0.30 Older Younger Response 2 Response 1 0.25 Younger Younger Younger 0.20 RESULTS: Task Performance Older Older Older 0.15 0.10 0.05 600 Standards (squares) 87% Targets (circles) 7% Novels (pictures) 6% Both age groups responded most rapidly to standards. Age differences in reaction time most pronounced in response to novels. For both age groups, Accuracy near 100% for Standards and novels. Accuracy for targets: Younger adults = 88% Older adults = 83% 0.00 -5 -4 -3 -2 -1 0 1 2 3 4 5 6 7 8 9 10 11 12 13 -5 -4 -3 -2 -1 0 1 2 3 4 5 6 7 8 9 10 11 12 13 Younger 550 -0.05 Older 500 -0.10 450 ACG Targets ACG Novels Reaction Time (ms) 400 350 300 250 200 Standard Target Novel Novels Targets MR Signal Change (%) Older Younger Younger Older 0.55 0.45 0.35 0.25 0.15 0.05 -5 -4 -3 -2 -1 0 1 2 3 4 5 6 7 8 9 10 11 12 13 -5 -4 -3 -2 -1 0 1 2 3 4 5 6 7 8 9 10 11 12 13 -0.05 -0.15 LOG Targets LOG Novels Novels Targets MR Signal Change (%) Younger Older Younger Older 0.55 0.45 0.35 0.25 0.15 0.05 -5 -4 -3 -2 -1 0 1 2 3 4 5 6 7 8 9 10 11 12 13 -5 -4 -3 -2 -1 0 1 2 3 4 5 6 7 8 9 10 11 12 13 -0.05 -0.15 FFG Targets FFG Novels ADULT AGE DIFFERENCES IN THE HEMODYNAMIC RESPONSE DURING VISUAL TARGET DETECTION MEASURED BY FUNCTIONAL MRI David J. Madden1, Scott A. Huettel1,3, Wythe L. Whiting1, Niko J. Harlan1, Linda K. Langley1, James M. Provenzale2, and Gregory McCarthy2,3 Departments of 1Psychiatry and Behavioral Sciences, 2 Radiology, and 3Brain Imaging and Analysis Center, Duke University Medical Center, Durham, NC author contact: djm@geri.duke.edu Time Course of Active Voxels • Visual Target Detection (Oddball) Task INTRODUCTION • Age Similarity: Middle Frontal Gyrus Response to Targets Previous fMRI research with visual oddball detection tasks suggests that, in younger adults, prefrontal cortical regions (especially the middle frontal gyrus) are activated by infrequent events that require a differential response, either overt or covert (Kirino et al., 2000; McCarthy et al., 1997). One goal of this experiment was to determine whether an age-related change in prefrontal activation would be evident in the visual oddball task. We extend previous fMRI studies of the oddball task, which have focused primarily on prefrontal regions, by imaging midbrain and visual cortical regions as well. A second goal was to obtain additional information regarding age-related changes in the form of the hemodynamic response. Previous research comparing younger and older adults’ hemodynamic response, during fMRI, indicates that the form of the hemodynamic response is similar for the two age groups, although activation is more extensive spatially and less variable for younger adults than for older adults (Huettel et al., 2001). These previous findings reflect the response of visual cortical regions during a sensory task (checkerboard viewing), and we sought to extend these analyses to the response of additional cortical regions during a more cognitive task. Participants instructed to use one response button for standards and novels, the other response button for targets. Display Duration = 500 ms. Novels and targets separated by a minimum of 5 standards. During fMRI scanning, participants performed 6 blocks of 180 trials, including 939 standards, 66 novels, and 75 targets. Targets Novels • Age Difference: Anterior Cingulate Response to Targets METHOD • Participants Healthy, right-handed, community-dwelling individuals; 16 younger adults (19-25 years; 8 female); 15 older adults (60-70 years; 8 female). The two groups were comparable in education and WAIS Vocabulary, but the older adults were worse in corrected visual acuity and on psychometric tests of memory, psychomotor speed, and executive functioning. • Imaging Parameters Structural: Sagittal localizer images (9; T1-weighted). High-resolution spin-echo (T1-weighted) images acquired at locations selected to encompass majority of prefrontal, basal ganglia, and visual cortical regions. There were 14 contiguous near-axial oblique slices (5 mm thick) selected parallel to the AC-PC plane. Functional: Spiral gradient-echo functional images at 1.5T. TR = 1 sec, TE = 40 ms, NEX = 1, Flip Angle = 81o, FOV = 24 cm, voxel size = 3.75 mm2 (642 matrix). Functional images acquired at same slice location as structural images. While in the magnet, participants viewed the displays through custom lenses ground to the best optical correction for each individual, obtained from a separate optometric examination. Preprocessing: Using custom MATLAB scripts, epochs were created that were time-locked to event types. The data were temporally aligned to correct for slice acquisition order within a TR. 19 time points (1 per sec) were extracted, including 1 at display onset, plus 5 time points before display onset and 13 time points following. • Age Difference: Lateral Occipital Gyrus Response to Novels RESULTS: Functional Imaging Peak of Average Response of All Voxels, 5 sec After Display Onset Young Adults Older Adults Z-Score Z-Score Targets Novels diff Targets Novels diff IFG 1.51 3.26p < .01 2.66 1.81n.s. MFG 3.07 2.5p < .052.45 1.54n.s. SFG -0.280.7 n.s.-0.76-1.28n.s. MOT 2.82 1.83n.s. 2.7 1.43n.s. ACG 5.23 -0.29 p < .001 1.51 -0.41 p < .01 CAU 3.51 -0.4 p < .001 1.6 0.78 n.s. INS 6.52 2.02p < .01 2.12 2.41n.s. PUT 3.31 0.76p < .01 1.59 0.9 n.s. THA 5.45 1.98p < .01 1.92 2.08n.s. CUN 2.56 0.84n.s. 0.93 0.57 n.s. FFG -0.050.14n.s. -0.19 0.33 n.s. LOG 1.13 2.35 n.s. 0.88 1.98n.s. Red = significant increases above baseline for targets at p < .01 Black = significant increases above baseline for novels at p < .01 diff = difference in activation between targets and novels 5 sec after display onset • Age Difference: Fusiform Gyrus Response to Novels CONCLUSIONS • Activation to novels occurs in visual processing regions and is greater for younger adults than for older adults, representing an age-related decline in visual sensory processing for these task conditions. • Anterior cingulate activation to targets is relatively greater for younger adults, which may represent more efficient attentional focus. • Activation of prefrontal cortex (MFG) to targets is similar for younger and older adults. • Task-related activation is not limited to prefrontal cortex and occurs throughout midbrain and visual regions. Regions of Interest (ROIs): ROIs were drawn on a slice-by-slice basis for each participant, using high-resolution structural images. The ROIs included prefrontal regions (superior, middle, inferior prefrontal gyri, motor cortex, anterior cingulate), midbrain (caudate, putamen, thalamus, insula), and visual regions (cuneus, lateral occipital gyrus, fusiform gyrus).