Download
1 / 19
190 likes | 332 Views
Intro Stats Lesson 2.1 B Objective: SSBAT construct an expanded frequency distribution chart. Standards: S2.5B. Expanded Frequency Distribution Adds 3 more columns to the frequency distribution from yesterday - Midpoints, Relative Frequency, and Cumulative Frequency

E N D
Intro Stats Lesson 2.1 B Objective: SSBAT construct an expanded frequency distribution chart. Standards: S2.5B
Expanded Frequency Distribution • Adds 3 more columns to the frequency distribution from yesterday - Midpoints, Relative Frequency, and Cumulative Frequency • These 3 columns will help to provide a better understanding of the data
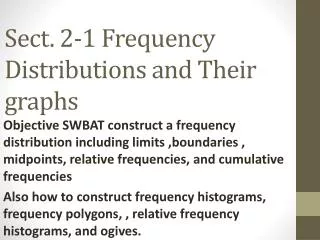
Midpoint of a Class • The Average of the lower and upper limit of each class • Midpoint of Class = • You will use this formula for each row of the frequency distribution
Relative Frequency • The portion or percentage of the data that falls in that class • Divide the Frequency of that Class by the number of data entries • Relative Frequency =
Cumulative Frequency • The sum of the Frequency for that class and all previous class frequencies
Find the Midpoints, Relative Frequency and Cumulative Frequency for the following.
Problem 1 continued. • Midpoints • = 4.5 • = 10.5 • = 16.5 • = 22.5 • = 28.5
Problem 1 continued. Relative Frequency = .19 .31 .19 .19 .11
Problem 1 continued. • Cumulative Frequency • The sum of the Frequency for that class and all previous classes 7 18 25 32 36
2. Find the Midpoints, Relative Frequency and Cumulative Frequency for the following. 12.5 24.5 36.5 48.5 60.5 72.5 84.5
2. Relative Frequency Frequency ÷ Total # .12 .2 .26 .16 .1 .12 .04 12.5 24.5 36.5 48.5 60.5 72.5 84.5
2. Cumulative Frequency Class Frequency + Above Frequencies 6 16 29 37 42 48 50 .12 .2 .26 .16 .1 .12 .04 12.5 24.5 36.5 48.5 60.5 72.5 84.5
4. Find the Midpoints, Relative Frequency and Cumulative Frequency for the following.
Homework Worksheet 2.1 B